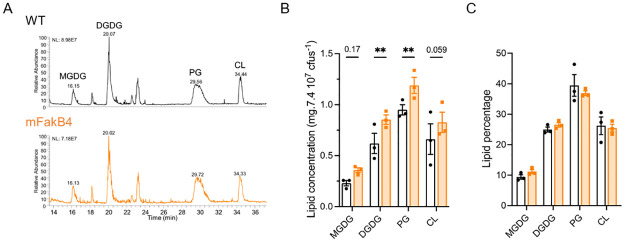
Fig 3. The WT and mFakB4 strains show different lipid quantities, but identical relative lipid composition.
Lipid content in the WT and mFakB4 strains grown in THY, by class of lipids: A-B) lipid composition; A) HPLC-MS profile representing the main lipid classes, B) lipid concentration, C) ratio of lipid classes; N = 3 (S2 Table). Bars and symbols, white, WT strain; orange, mFakB4 strain; MGDG, monogalactosyldiacylglycerol; DGDG, digalactosyldiacylglycerol; PG, phosphatidylglycerol; CL, cardiolipin. 2-way ANOVA, Bonferroni post-test, **p<0.01; p values are indicated when between 0.05 <p<0.2.

