Figure 4.
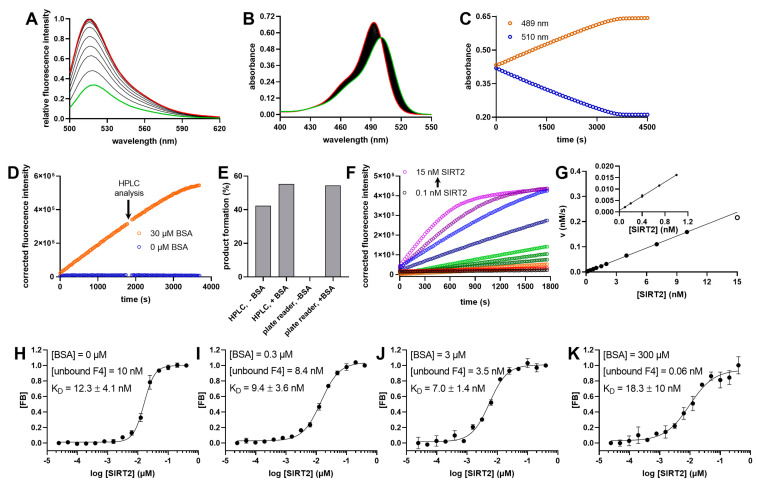
Continuous activity assay for SIRT2 using F4 as a substrate. (A) Fluorescence spectra of 1µM F4 subsequent to treatment with 30 nM SIRT2 in the presence of 500 µM NAD+ and 30 µM BSA. The green line shows the first, and the red line the last, spectrum recorded (total recording time 30 min). (B) Absorbance spectra of 10 µM of F4 after the addition of 100 nM of SIRT2 in the presence of 500 µM of NAD+. The green line shows the first, and the red line the last, spectrum recorded (total recording time 30 min). (C) Progress curves at two different wavelengths extracted from (B). (D) Progress curves of SIRT2-mediated cleavage of F4 measured in a 96-well plate format as changes in fluorescence intensities. After 1800 s, the measurement was interrupted, and the reaction mixture from individual wells was analyzed by HPLC. The fluorescence detection was continued afterwards. (E) Determination of the product formation of the reaction solution of (D) using HPLC with an absorbance detection at 450 nm and the fluorescence intensity readout of a 96-well MTP reader. Product formation in the MTP experiment was calculated using the total change in the fluorescence intensity as 100%. (F) Cleavage of 0.25 µM of F4 mediated by different concentrations of SIRT2 in the presence of 500 µM of NAD+ at room temperature. Detection was performed via changes in fluorescence intensity with λEx = 485 ± 14 nm and λEm = 535 ± 25 nm. All fluorescence values were corrected with a negative control without enzymes. The rate of this reaction was plotted as a function of the SIRT2 concentration in (G), and shows a linear relationship up to a SIRT2 concentration of 10 nM. (H–K) Binding curves of F4 (10 nM) to SIRT2 in the absence of NAD+ at different concentrations of BSA, monitored via fluorescence polarization and with three independent replicates. FB signifies the fraction bound to SIRT2.

