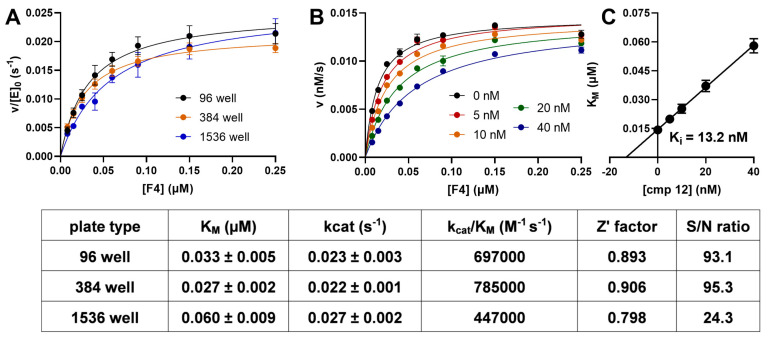
Figure 5.
v/[S] plots of SIRT2 with F4 under different conditions. (A) The kinetic parameters for SIRT2 and F4 in a 96-well MTP format compared to 384- and 1536-well MTP formats. The resulting kinetic parameters and the Z′-factors together with the respective S/N ratios for a 90% processed reaction mixture with SIRT2 and F4 at a 1 µM concentration are summarized in the table under the figure. Data points used for the Z′-factor calculation can be found in Figure S11. The values in the table represent the mean of three independent replicates. (B) v/[S] plot of SIRT2 (1 nM) with different concentrations of F4, 500 µM of NAD+, and different concentrations of cmp12 [66]. A nonlinear regression analysis was done according to the Michaelis-Menten equation. Lineweaver-Burk and Hanes-Woolf plots for these data can be found in Figure S14. (C) Plot of the KM values from panel B as a function of the inhibitor concentration. The intercept with the abscissa represents the negative Ki value.

