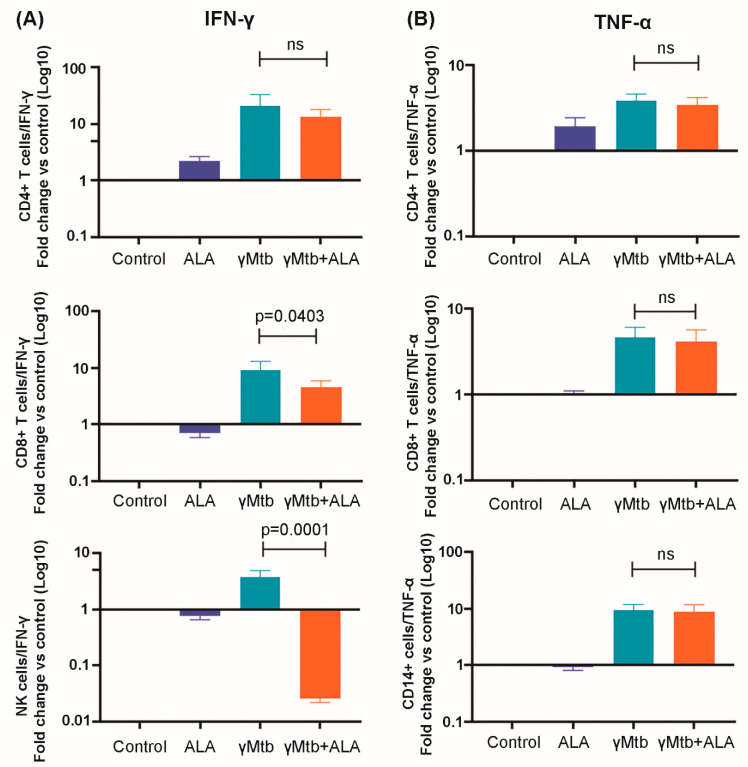
Figure 3.
IFN-γ and TNF-α gene expression profile of various immune cells in γMtb-cultured PBMCs of LTBI+ donors. PBMCs of healthy LTBI+ donors were cultured with or without γMtb (10 μg/mL) and in the presence or absence of ALA, as mentioned in the Methods section. After 48 h, various immune cells were isolated via flow sorting, RNA was collected, and real-time PCR analysis was performed to determine IFN-γ and TNF-α gene expression: (A) IFN-γ transcription levels in different cell types; (B) TNF-α transcription levels in different cell types. PBMCs from five LTBI+ donors were used for the study. Paired t-tests were used to compare the differences between untreated and treated PBMCs from the same samples. The significant p values are shown (p < 0.05). ns: not significant.

