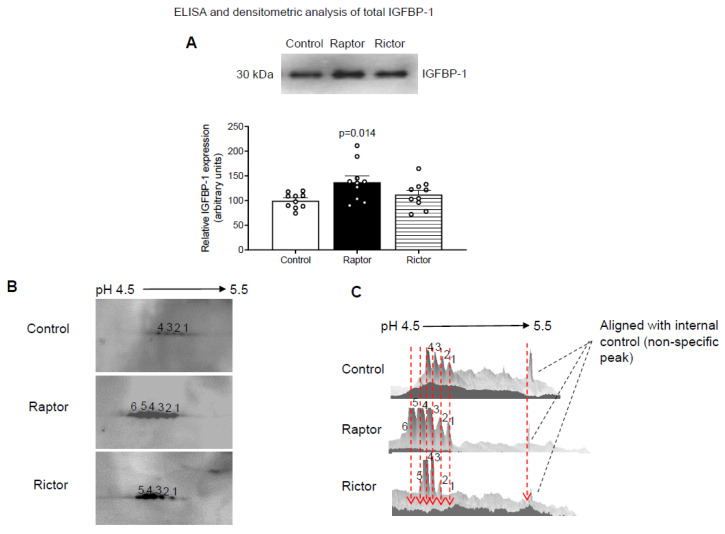
Figure 2.
Analysis of IGFBP-1 secretion and IGFBP-1 phosphorylation by 1-D and 2-D immunoblot analysis using CM from HepG2 cells incubated with CM from PHT cells with the control, RAPTOR, and RICTOR siRNA. For a densitometric analysis (A), proteins in equal aliquots of CM from HepG2 cells (7 µL) treated with CM from PHT cells with the control (non-coding siRNA), RAPTOR, and RICTOR siRNA were separated and probed using anti-human IGFBP-1 monoclonal antibody (mAb 6303). The data were normalized to the control (average arbitrarily set to 100) with Mean + SEM, analyzed with one-way ANOVA, and corrected with Bonferroni multiple comparison test; p < 0.05 was considered significant. (B) Equal aliquots of HepG2 CM (100 µL) from PHT cells with Control (non-coding siRNA), RAPTOR, and RICTOR siRNA were exchanged against a rehydration buffer and loaded onto a 7 cm IPG strip followed by 2-D gel electrophoresis and a Western blot using anti-human IGFBP-1 polyclonal antibody. The spots on the blots (B) corresponded to IGFBP-1 phosphoisoform in CM from HepG2 cells treated with CM from PHT cells with the control (non-coding siRNA), RAPTOR, and RICTOR siRNA. The corresponding 3-D view (C) of IGFBP-1 phosphoisoform in the control, RAPTOR, and RICTOR is represented in the adjacent figure on the right.

