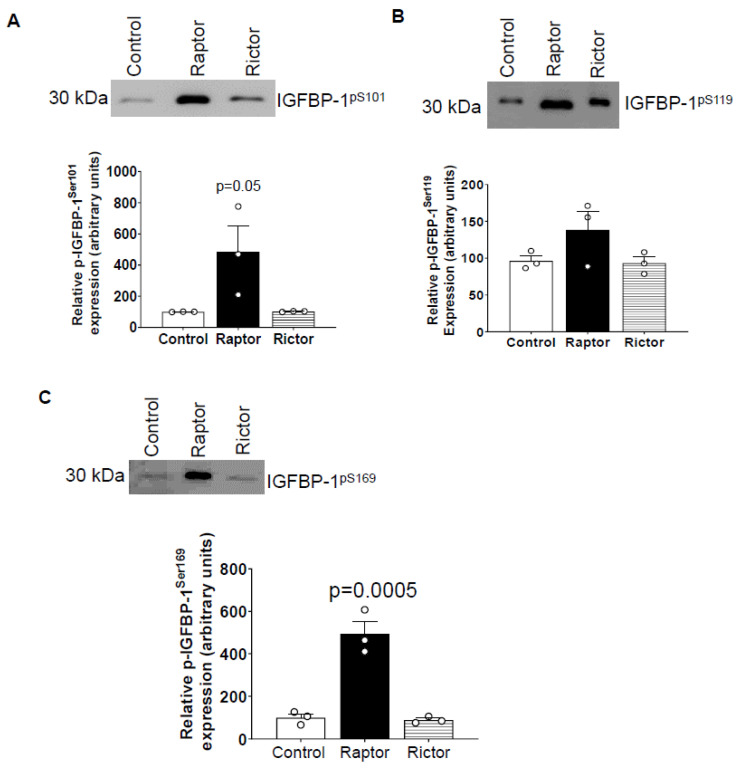
Figure 3.
Site-specific IGFBP-1 phosphorylation in CM from HepG2 cells treated with CM from PHT cells with the control (non-coding siRNA), RAPTOR, and RICTOR siRNA. Equal aliquots of CM (μL) from HepG2 treated with CM from PHT cells with the control (non-coding siRNA), RAPTOR, and RICTOR siRNA was used to determine site-specific IGFBP-1 phosphorylation. CM (40 µL) was loaded on 1-D gels for Western blot for pSer101 (A), pS119 (B), and pS169 (C) IGFBP-1. The band intensity of each sample was normalized to the control (average arbitrarily set to 100). Data were presented in the bar figure as Mean + SEM, analyzed using one-way ANOVA, and corrected with Bonferroni Multiple Comparison tests; p < 0.05 was considered significant.

