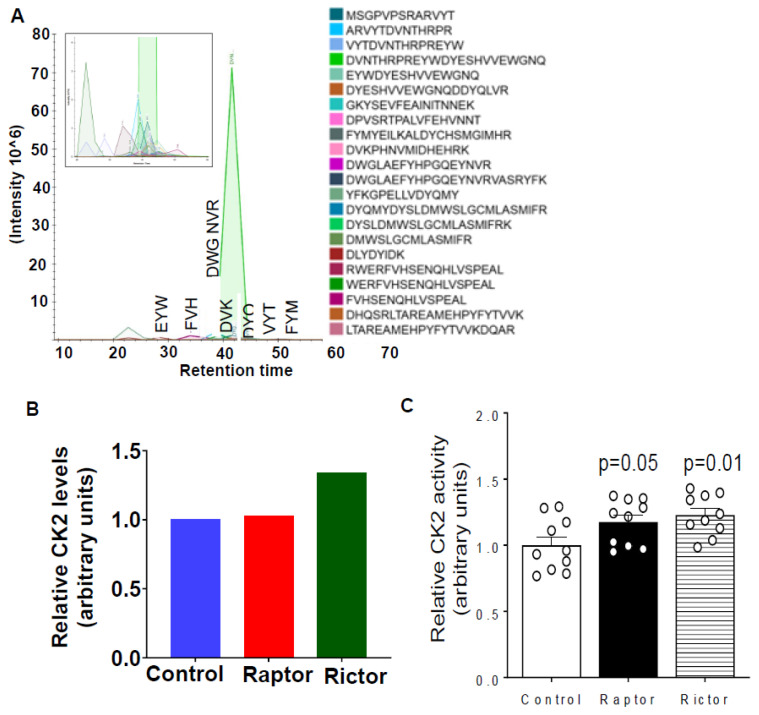
Figure 5.
HepG2 cells incubated in CM from PHT cells with mTORC1 or mTORC2 inhibition increased CK2 activity. (A) Detection of CK2 peptides with PRM-MS; displaying chromatograms of individual peptides. The inset displays lower-intensity peptides. (B) Relative CK2 levels co-immunoprecipitated with IGFBP-1 from HepG2 CM after treatment with CM from PHT cells with either the control, RAPTOR (Rap), or RICTOR (Ric) siRNA. The total peak area for each treatment was normalized to that of the control. (C) CM from PHT cells with either mTORC1 or mTORC2 inhibition activated CK2 activity in HepG2.

