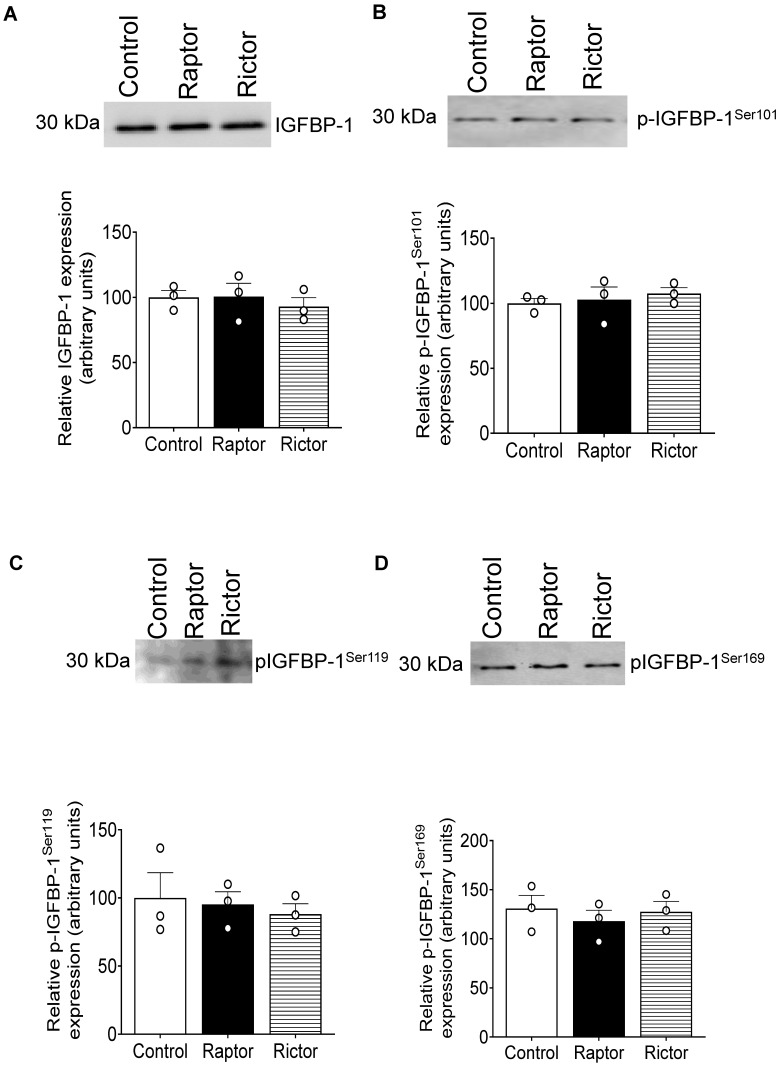
Figure 9.
Analysis of IGFBP-1 secretion and phosphorylation from HepG2 cells after treatment by Renal Carcinoma cells transfected with the control, RAPTOR, and RICTOR siRNA. Equal aliquots of HepG2 cell media (7 μL) were loaded on 1-D gels for a Western blot using anti-human IGFBP-1 monoclonal antibody (mAb 6303) (A); 40 μL loaded for pSer101 (B), pSer119 (C), and pSer169 (D). Samples were normalized to the control. The data were represented as Mean + SEM in bar figures and analyzed with a one-way ANOVA and Bonferroni Multiple Comparison tests; p < 0.05 was considered significant.

