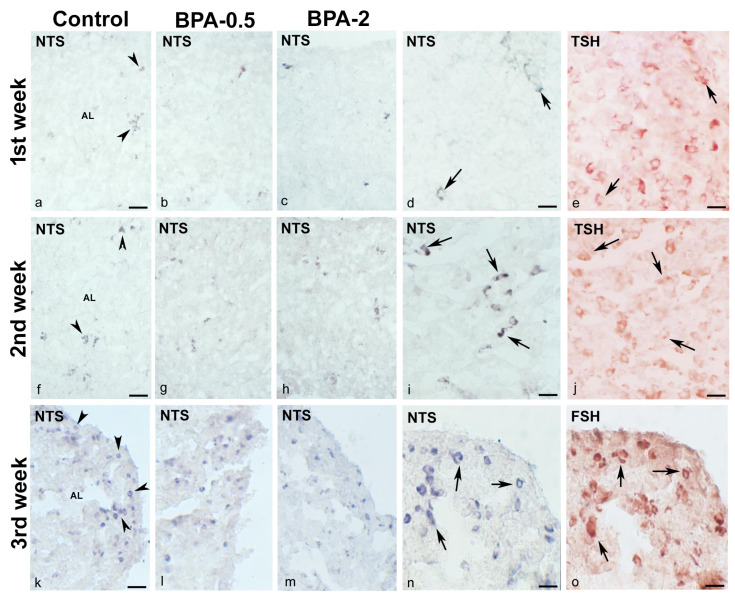
Figure 4.
NTS immunoreactivity in offspring pituitary glands. Representative images of the pituitary gland in the first three weeks of postnatal life in the three experimental groups showing the presence of NTS-ir cells (arrowheads) in the central area of the anterior lobe in the 1st (a–e) and 2nd (f–j) weeks and in the margins of the anterior lobe in the 3rd week (k–o). Images (d,e) and (i,j) show NTS colocalization with TSH (arrows) in the 1st and 2nd weeks in control and BPA-0.5, respectively, and images (n,o) show NTS colocalization with FSH (arrows) in the 3rd week in BPA-2. AL: anterior lobe. Scale bars: (a–c), (f–h), and (k–m): 60 µm; (d,e), (i,j), and (n,o): 25 µm. (a–d), (f–i), and (k–n) immunoperoxidase chloronaphthol. (e,j,o) immunoperoxidase ethyl carbazole.

