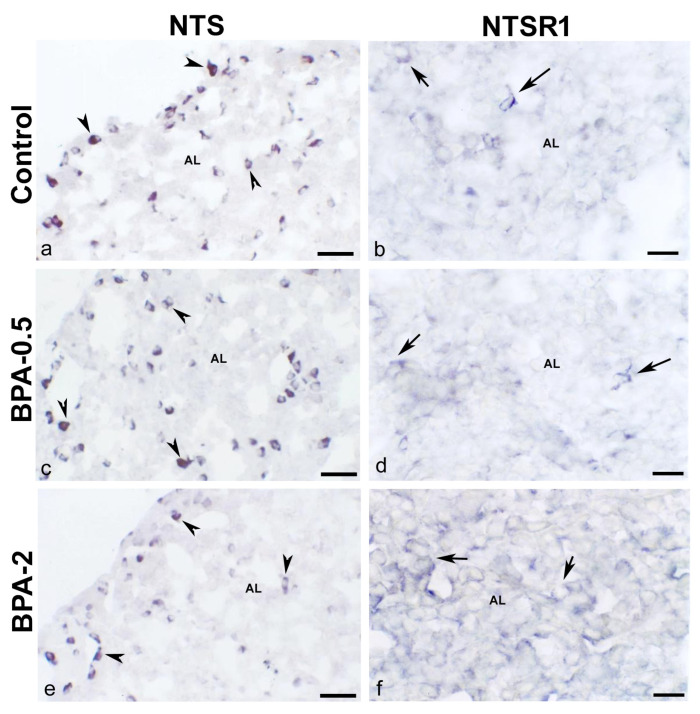
Figure 6.
NTS and NTSR1 immunoreactivity in the mother’s pituitary gland. Representative images of the pituitary gland in mothers after weaning/lactation showing the presence of NTS-ir cells (arrowheads) (a,c,e) and NTSR1-ir cells (arrows) (b,d,f) in the three experimental groups. AL: anterior lobe. Scale bars: (a,c,e): 35 µm and (b,d,f): 25 µm.

