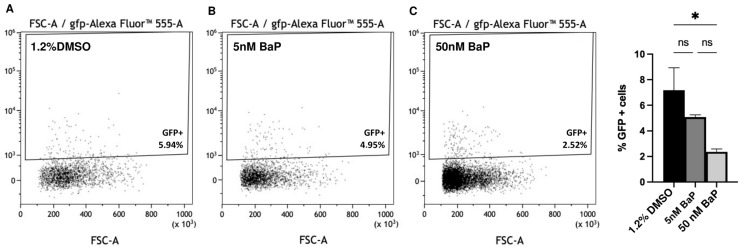
Figure 3.
Quantification of the GFP+ cells by flow cytometry analysis of the GnRH3 neuron cells (A–C). The % of GFP+ cells are reported in (D). ONE way ANOVA with Tukey post hoc correction. Results are presented as mean ± SEM. * p < 0.05; ns = not significant. Experiments were performed in triplicates using pools of 1.2% DMSO, and BaP treated embryos at 48 hpf.

