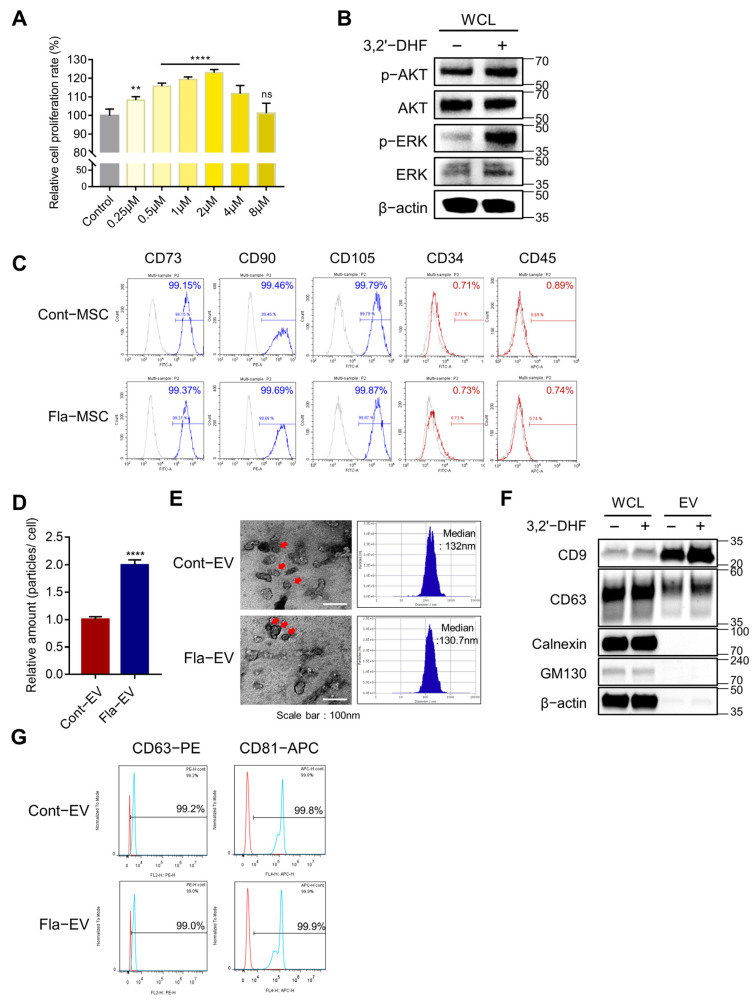
Figure 2.
Characterization of 3,2′-DHF-treated WJ-MSCs and EVs. (A) The proliferation rate of WJ-MSC treated with various concentrations of 3,2′-DHF. WJ-MSCs have the best proliferation rate with 1–2 μM 3,2′-DHF. Statistical analysis was determined using one-way ANOVA with Tukey’s multiple comparisons test: ** p < 0.05, **** p < 0.0001. (B) Protein expression of MEK/ERK signaling proteins in WJ-MSCs with and without 3,2′-DHF treatment. The bar graph shows the protein expression of AKT and MEK in 3,2′-DHF-treated and untreated WJ-MSCs. (C) Flow cytometry analysis to confirm the characteristics of WJ-MSCs with or without 3,2′-DHF. The expression of the positive markers CD73, CD90, and CD105, and the negative markers CD34 and CD45, was assessed. (D) The relative EV production amounts of Cont-EV and Fla-EV were measured using nanoparticle tracking analysis (NTA). Statistical analysis was determined using two-way ANOVA: **** p < 0.0001. (E) Transmission electron microscopy (TEM) images of Cont-EV and Fla-EV. Scale bar: 100 nm. The size of the EVs was determined with NTA. (F) Characterization of EV-positive markers CD9 and CD63, and negative markers calnexin and GM130, in Cont-EV and Fla-EV using Western blotting. (G) Representative plot of EV-surface markers CD63 and CD81 in Cont-EV and Fla-EV via flow cytometry analysis.

