Figure 3.
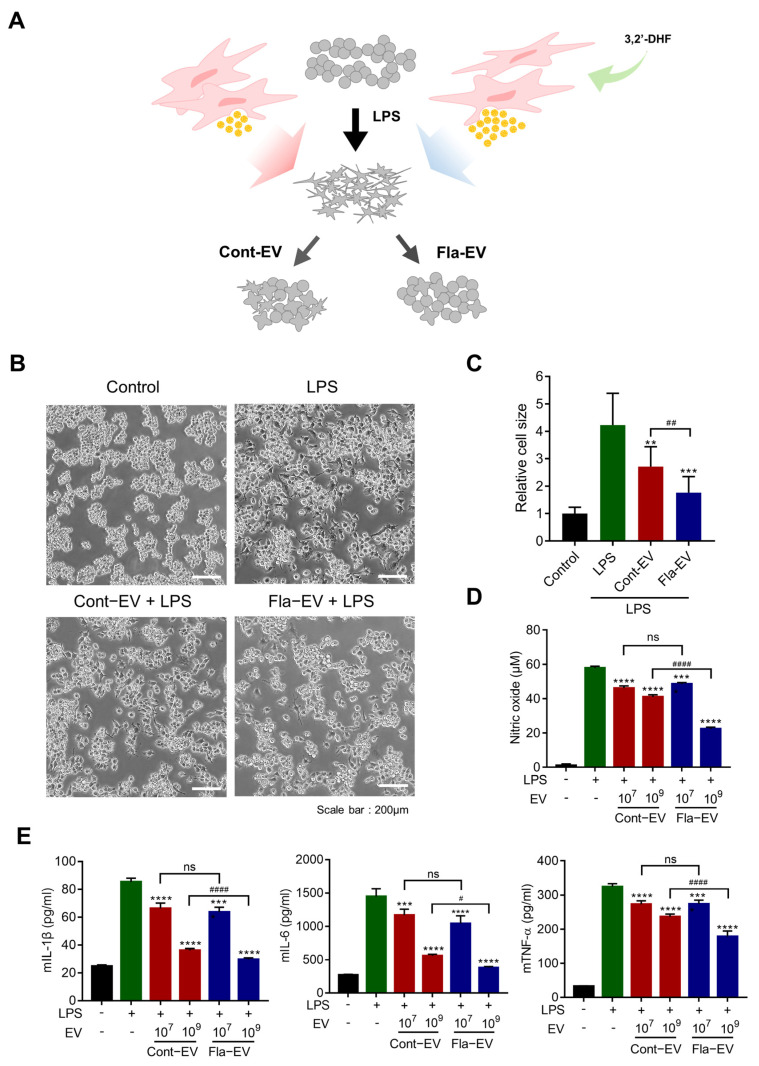
Anti-inflammatory effects of Fla-EVs in RAW 264.7 cells. (A) Schematic anti-inflammatory assay of RAW 264.7 cells with LPS and EVs. (B) Representative images of RAW 264.7 cells incubated with LPS and EVs for 24 h. Scale bar: 200 μm. (C) Relative size of each cell as analyzed with image J. Statistical analysis was determined using one-way ANOVA with Tukey’s multiple comparisons test: ## p < 0.01, ** p < 0.01, *** p < 0.001. (D,E) RAW 264.7 cells were co-treated with 10 ng/mL of LPS and EVs (1 × 10⁷ and 1 × 10⁹ particles, respectively). (D) Nitric oxide levels as determined with the Griess assay. (E) Expression level of inflammatory cytokines, including mIL-1β, mIL-6, and mTNF-α, as measured with ELISA. Statistical analysis was determined using one-way ANOVA with Tukey’s multiple comparisons test: # p < 0.05, #### p < 0.0001, *** p < 0.001, **** p < 0.0001. # compared with the LPS group and * indicate comparisons between Cont-EV and Fla-EV.

