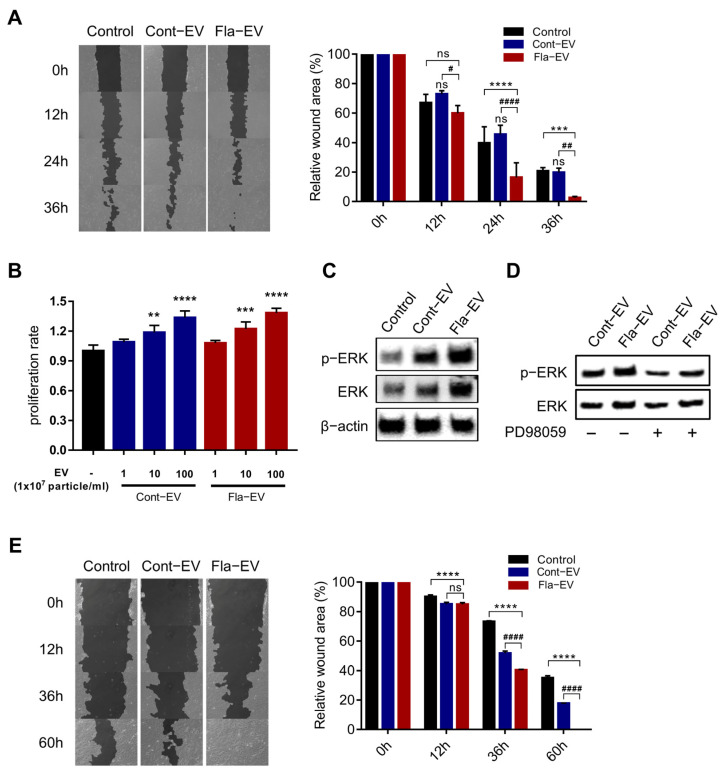
Figure 4.
In vitro wound-healing effects of Fla-EVs. (A) Representative image of NHDFs incubated with EVs after scratching. The bar graph shows the relative wound area in each group. * indicates comparison with control and # indicates comparison with Cont-EV. Statistical analysis was determined using two-way ANOVA with Tukey’s multiple comparisons test: # p < 0.05, ## p < 0.01, #### p < 0.0001, *** p < 0.001, **** p < 0.0001. * indicates comparison with control and # indicates comparison with Cont-EV. (B) Proliferation rate of NHDFs treated with 1 × 10⁷, 1 × 10⁸, and 1 × 10⁹ EV particles. Statistical analysis was determined using one-way ANOVA with Tukey’s multiple comparisons test: ** p < 0.01, *** p < 0.001, **** p < 0.0001. * indicates comparison with control. (C) Western blot image showing p-ERK and ERK expression levels in EV-treated NHDFs. (D) Representative Western blot image of EV-treated NHDFs with or without PD98059. (E) Representative image of HaCaTs incubated with EVs after scratching. The bar graph shows the relative wound area in each group. Statistical analysis was determined using two-way ANOVA with Tukey’s multiple comparisons test: #### p < 0.0001, **** p < 0.0001. * indicates comparison with control and # indicates comparison with Cont-EV.

