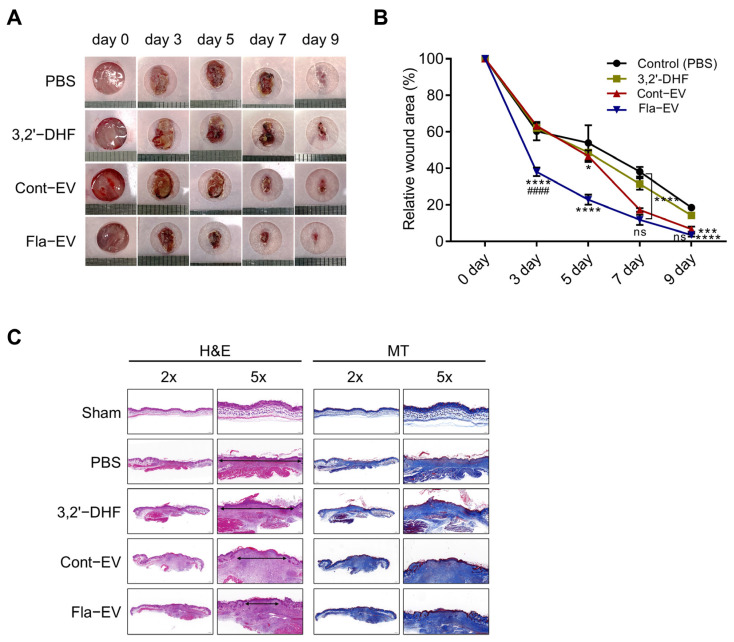
Figure 5.
In vivo wound-healing effects of Fla-EVs. (A) Representative images of wounds monitored every two days until day 9. (B) Graphical data describing relative wound areas calculated to the wound area on day 0 in each group. Statistical analysis was determined using two-way ANOVA with Tukey’s multiple comparisons test: #### p < 0.0001, *** p < 0.001, **** p < 0.0001. * indicates comparison with control and # indicates comparison with Cont-EV. (C) Histological analysis of the wound area via hematoxylin and eosin and Masson’s trichrome staining. * p < 0.05, *** p < 0.001, **** p < 0.0001 compared with control; #### p < 0.0001 indicates comparison between Cont-EV and Fla-EV.

