Figure 3.
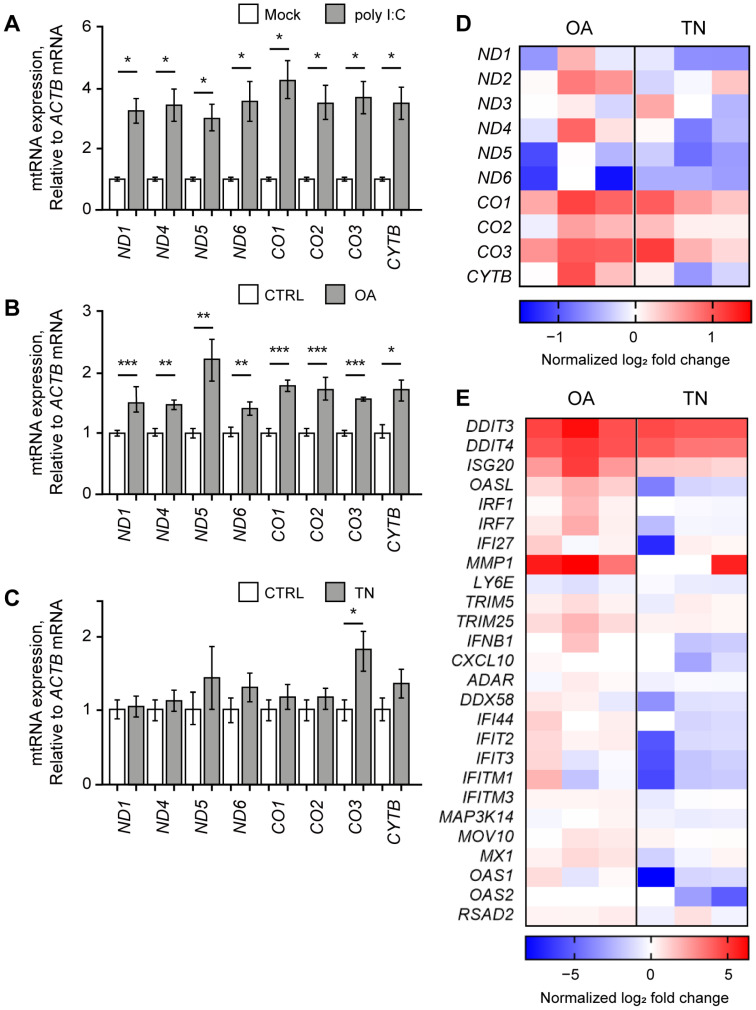
OA elevated mtRNA and ISG expressions. The expression of mtRNAs in HCT116 cells upon poly I:C transfection (A), OA treatment (B), or TN treatment (C). All Cq values are relative to that of ACTB mRNA. The values of poly I:C-transfected samples were normalized to the mock-transfected samples, and values of OA- or TN-treated samples were normalized to the DMSO-treated samples. (D,E) Heatmap of differentially expressed genes represents mtRNAs (D) and ISGs (E) upon OA or TN treatment. Each column represents the log2 fold change of three biological replicates with OA or TN treatment normalized by the control average. Unless mentioned otherwise, three independent experiments were carried out, and error bars denote s.e.m. All statistical significances were calculated using one-tailed Student’s t-tests; * p ≤ 0.05, ** p ≤ 0.01, and *** p ≤ 0.001.

