Figure 4.
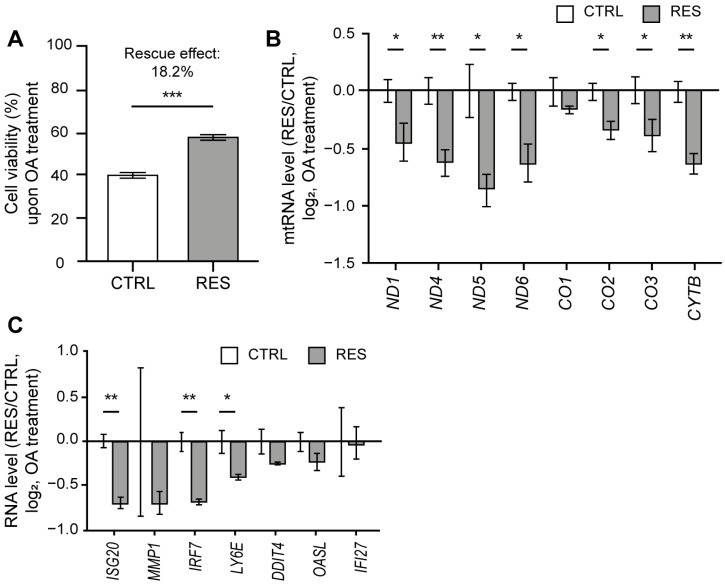
RES treatment alleviated cell death and IFN response to OA. (A) Cell viability upon OA treatment with or without RES treatment measured using a SRB assay. (B) The ratios of mtRNA induction upon OA treatment between RES-treated and control samples. (C) The ratios of ISG induction upon OA treatment between RES-treated and control samples. For ratios, Cq values were first normalized to that of ACTB mRNA. For untreated samples, the values were normalized to RNAs from control cells without OA treatment. Similarly, RNAs from cells co-treated with RES and OA were normalized separately from those from cells treated only with RES without OA. Unless mentioned otherwise, three independent experiments were carried out, and error bars denote s.e.m. All statistical significances were calculated using one-tailed Student’s t-tests; * p ≤ 0.05, ** p ≤ 0.01, and *** p ≤ 0.001.

