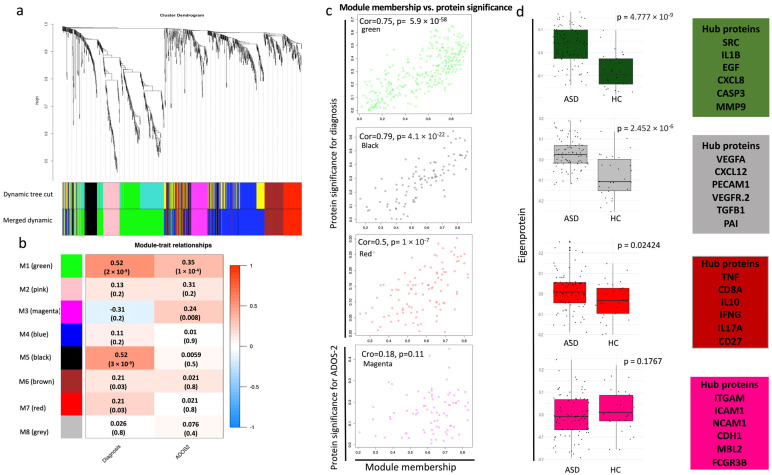
Figure 4.
Weighted gene co-expression network analysis (WGCNA). (a) Protein dendrogram obtained by average linkage hierarchical clustering of the 1124 proteins. The color bands underneath the dendrogram show the module obtained from the dynamic tree cut. (b) The module trait relationship (p-value and correlation) for the identified modules in relation to the clinical traits. (c) Scatterplots of protein significance versus module membership in modules that significantly correlated with the clinical phenotypes (M1, M3, M5, M7). Protein significance versus module membership exhibits a significant correlation. Module membership is each protein’s expression level correlated with the module’s eigengene/epiprotein (the first principal component). For a protein to be assigned to a particular module, its module membership value must be close to 1 or −1. (d) Boxplots of the eigenprotein (the first principal component value of each sample) between ASD cases and HCs in the significant modules, and the boxes on the right show the hub proteins in each module; t-test was used to assess the significance between the two groups (p-value < 0.05).

