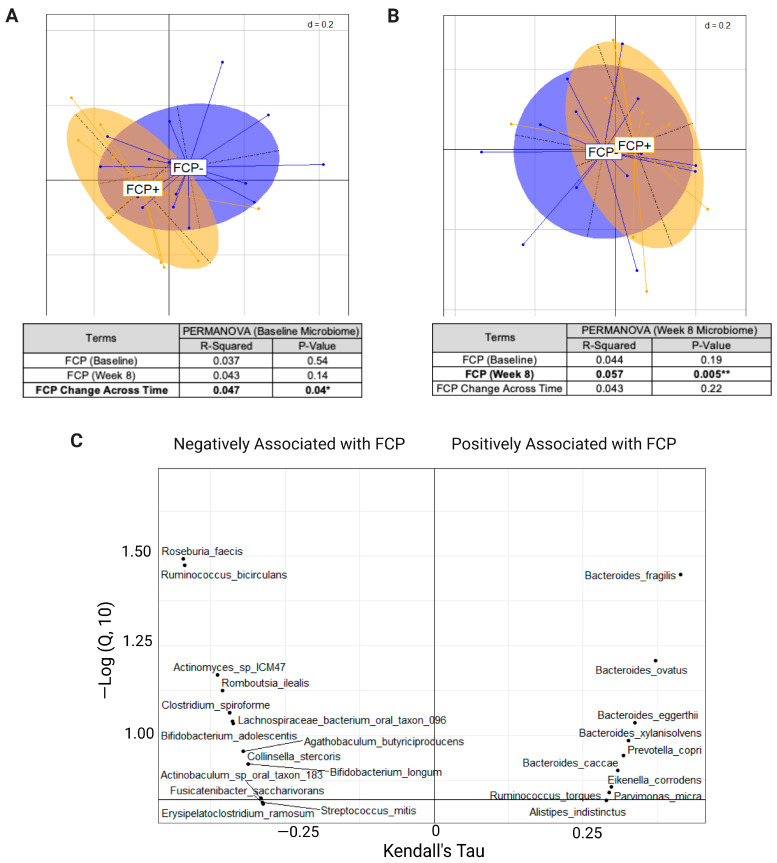
Figure 2.
Associations between fecal calprotectin (FCP) and the microbial taxa. (A) PCoA plot of baseline microbiome profiles of participants that had an increase in FCP (FCP+; orange) vs. a decrease in FCP (FCP−; blue) from baseline to week 8. PERMANOVA values of the association of baseline microbiome with baseline FCP, week 8 FCP and change in FCP are indicated below the figure. (B) PCoA plot of week 8 microbiome profiles of participants that had an increase in FCP (FCP+; orange) vs. decrease in FCP (FCP−; blue) from baseline to week 8. PERMANOVA values of the association of week 8 microbiome with baseline, week 8 FCP and change in FCP are indicated below the figure. (C) Identification of the specific species of microbes associated with fecal calprotectin at week 8. Asterisks indicate the significance level: ** p < 0.01, * p < 0.05. Abbreviations: FCP, fecal calprotectin; PCoA, principle coordinate analysis; PERMANOVA, permutational multivariate analysis of variance.

