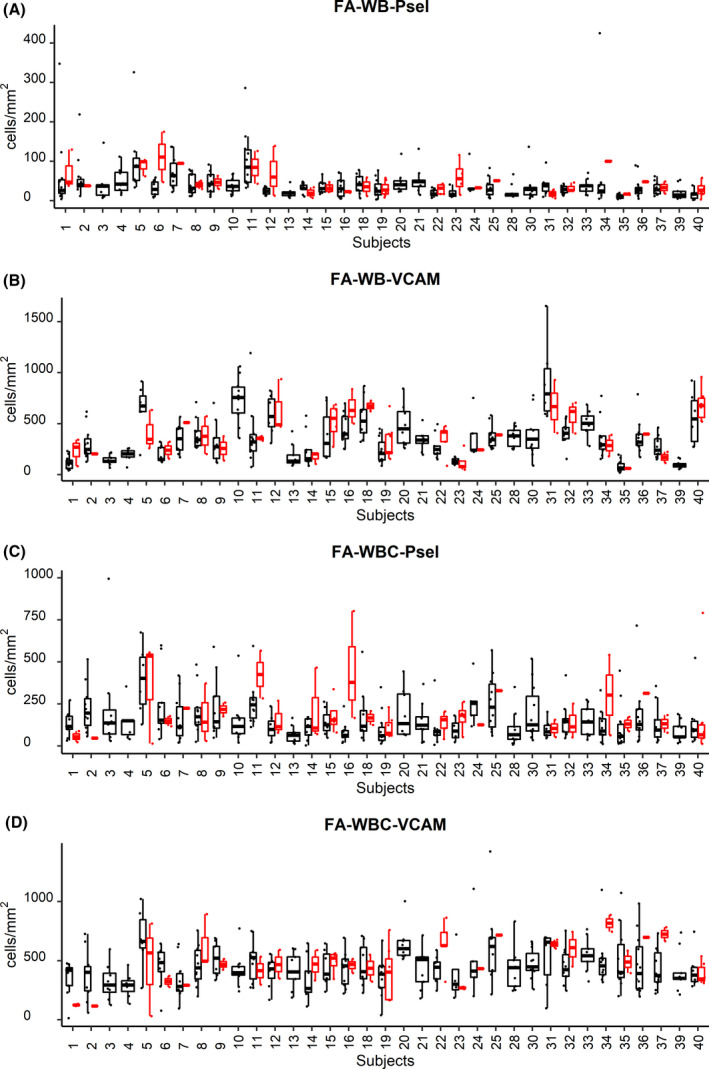
Fig 1.

Interpatient variation of flow adhesion biomarkers. Interpatient variation of biomarkers at steady state in whole blood (WB; A and B) and isolated white blood cell (WBC; C and D) for flow adhesion on P‐selectin (A, C) and VCAM‐1 (B, D) substrates presented as box and whiskers plots. Bottom and top of the box correspond to the first and third quantiles; band inside is the median. Whiskers show 1·5 interquartile range. (black points are steady‐state samples, red points are vaso‐occlusion crisis samples).
