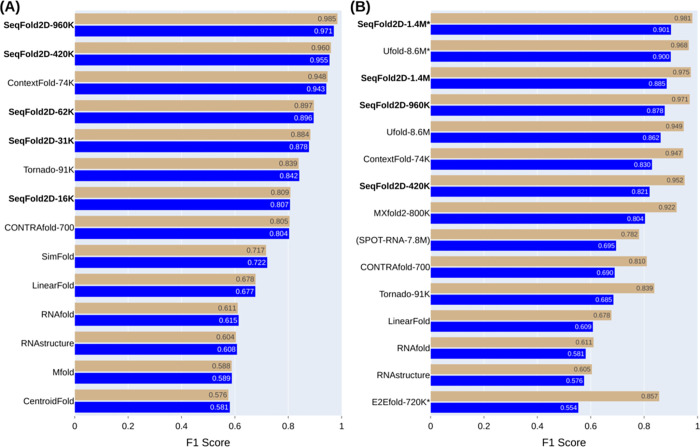
Fig 2. The mean F1 scores on the TR (tan) and TS (blue) sets by SeqFold2D and selected DL and traditional models in two different dataset setups.
(A) Both TR and TS sets are from Stralign NR100. (B) TR from Stralign NR100 and TS from ArchiveII NR100.The models are sorted by their TS F1 scores. The names for the learning-based models are appended with the number of parameters and the trailing asterisk indicates the use of post-processing. At the end of each bar shows the F1 value. All learning-based models except SPOT-RNA are re-trained.

