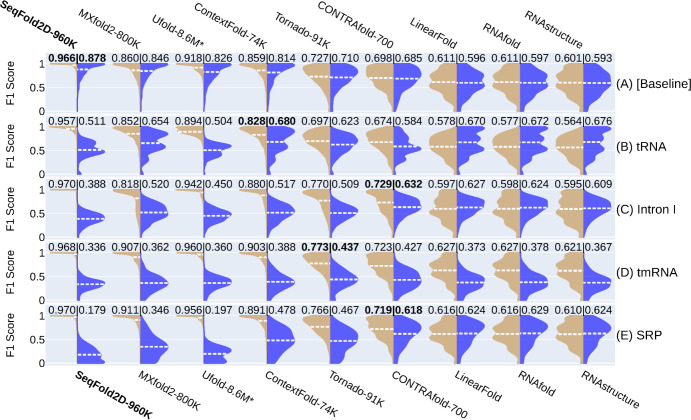
Fig 4. Illustrations of the TR (left, tan) vs. TS (right, blue) performances for selected learning and physics-based models at the cross-family level with the Strive-NR80 dataset.
For each cross-family study, one RNA family is held out as the TS set and the rest eight families are used for model development (TR and VL). Each panel/row here shows one such study labelled by the TS family name (B-E), while the first panel, (A) [Baseline], shows a baseline study with randomly splits of all families for the TR, VL, and TS subsets. Panel A thus is de facto a cross-cluster study with all subsets derived from the same parent dataset. For each panel, the average TR and TS scores are shown at the top and highlighted for the learning-based model with the highest TS score (physics-based models excluded). All learning-based models are retrained with the numbers of parameters shown after names. It should be noted that, despite our best re-training efforts, the scores of MXfold2 and Ufold should be viewed as guides only as we are unable to match their reported performances when using the same datasets. Still, given the inverse correlation between TR and TS performances, their TR-TS gaps are expected to be under-estimates.

