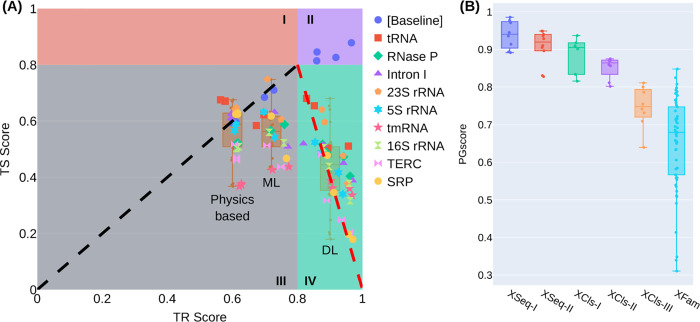
Fig 5. Illustrations of the cross-family F1 scores and the PGscore distributions for all studies.
(A) The TS vs. TR F1 scores of the baseline cross-cluster study ([Baseline]) and all nine cross-family studies (labelled by the TS family name) with Strive-NR80. Four zones (I-IV) are delineated for easy reference. The diagonal line in zone III denotes the line of zero TR-TS gap, i.e., TR = TS. The dash line in zone IV is a guide to the eye only. The cross-family TS scores of the three groups of models (physics-based, ML, and DL) are shown in three respective boxplots as annotated. (B) Boxplots of the PGscores from all learning-based models for each study at the specific TR-TS similarity level. The studies are, XSeq-I: the cross-sequence study with Stral-NR100, XSeq-II: cross-sequence with Stral-NR100 and Archi-NR100, XCls-I: cross-cluster with Strive-NR80, XCls-II: cross-cluster with Stral-NR80 and Archi-Stral-NR80, XCls-III: cross-cluster with bpRNA, XFam: all nine cross-family studies with Strive-NR80. The learning-based models included for each study are shown in Figs T-U in S1 Text.

