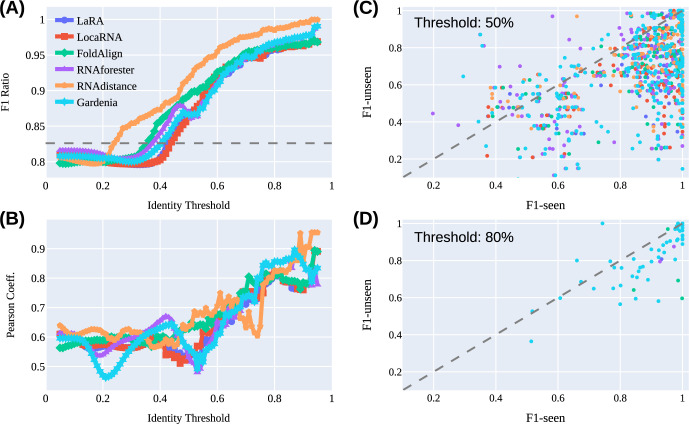
Fig 6. Illustrations of the F1-unseen vs. F1-seen correlations of the SeqFold2D-960K model.
Each PSA or PSSA program is shown in the same color in all panels. (A) The F1-unseen over F1-seen ratio as a function of the PSI or PSSI threshold. The horizontal dashed line marks the F1 ratio between the entire unseen and seen datasets. (B) The PCC value as a function of the identity threshold. (C) The distributions of the F1-unseen and F1-seen scores at the nominal PSI or PSSI threshold of 50%. (D) The distributions of the F1-unseen and F1-seen scores at the identity threshold of 80%. It is common to find no seen sequences above high thresholds for an unseen sequence, leading to many null F1-seen values that are absent in (D).

