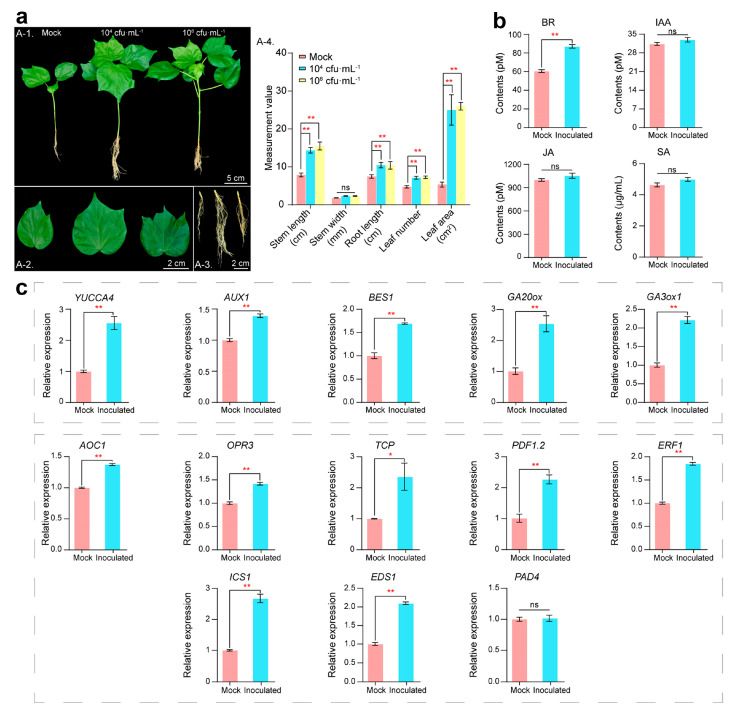
Figure 2.
Phenotypic changes in cotton 30 days after inoculation with B. paralicheniformis RP01. (a) The changes in phenotype of the whole plant (A-1), enlarged leaf (A-2) and enlarged root (A-3). Plant biomass data (A-4). Leaf area is measured as the area of the third leaf from the top bud. Treatment groups from left to right are the mock, 104 cfu/mL and 108 cfu/mL groups. (b) Hormone content of cotton leaves. (c) Hormone-related genes by RT-qPCR. Error bars represent standard error (SE). Statistical significance was calculated using one-way analysis of variance (ANOVA) followed by Bonferroni’s post hoc test. The asterisk (*) indicates a significant difference at p < 0.05; (**) indicates p < 0.01.

