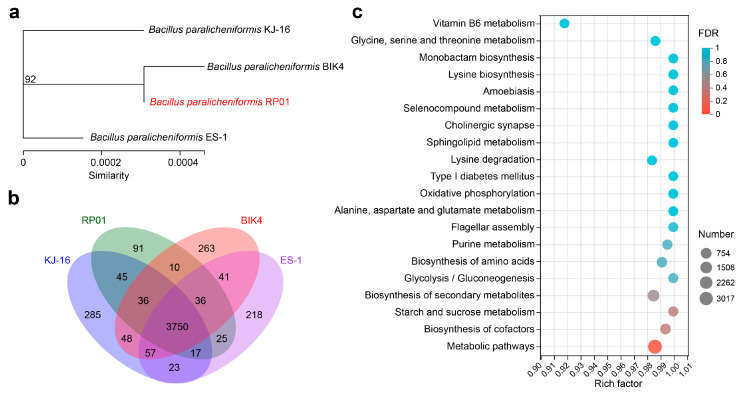
Figure 7.
Comparative analysis of the B. paralicheniformis RP01 genome. (a) Molecular evolutionary tree for the four strains. The tree was built using housekeeping genes (dnaG, frr, infC, nusA, pgk, pyrG, rplA, rplB, rplC, rplD, rplE, rplF, rplK, rplL, rplM, rplN, rplP, rplS, rplT, rpmA, rpoB, rpsB, rpsC, rpsE, rpsI, rpsJ, rpsK, rpsM, rpsS, smpB and tsf) by maximum likelihood method with a bootstrap value of 1000. (b) Venn diagram shows the number of genes in all four strains. (c) KEGG enrichment analysis of homologous genes in four strains. The X-axis represents rich rate (refers to the ratio of the number of genes enriched in the pathway to the number of annotated genes; a larger ratio indicates greater enrichment). The size of the point indicates the number of genes in this pathway and the color of the point indicates the significance of enrichment.

