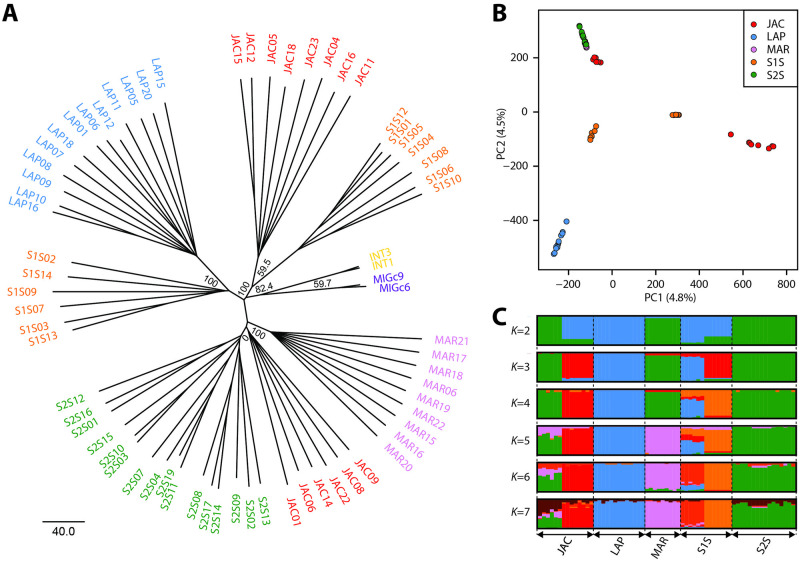
Fig 3. Lutzomyia longipalpis population structure.
Inferred population structure of Lu. longipalpis individuals collected from Marajó (MAR; pink), Lapinha (LAP; blue), from Jacobina (JAC; red), and Sobral, including Sobral 1S (S1S; orange) and 16 Sobral 2S (S2S; green). (A) Rooted neighbor joining (NJ) radial tree. We included both N. intermedia (INT; yellow) and M. migonei (MIG; purple) and used M. migonei to root the trees. Bootstrap values represent the percentage of 1,000 replicates. (B) Principal component analysis (PCA). Individuals were plotted according to their coordinates on the first two principal components (PC1 and PC2). (C) Admixture analysis. Ancestry proportions for Admixture models from K = 2 to K = 7 ancestral populations. Each individual is represented by a thin vertical line, partitioned into K coloured segments representing the individual’s estimated membership fractions to the K clusters. These data are the average of the major q-matrix clusters derived by CLUMPAK analysis.

