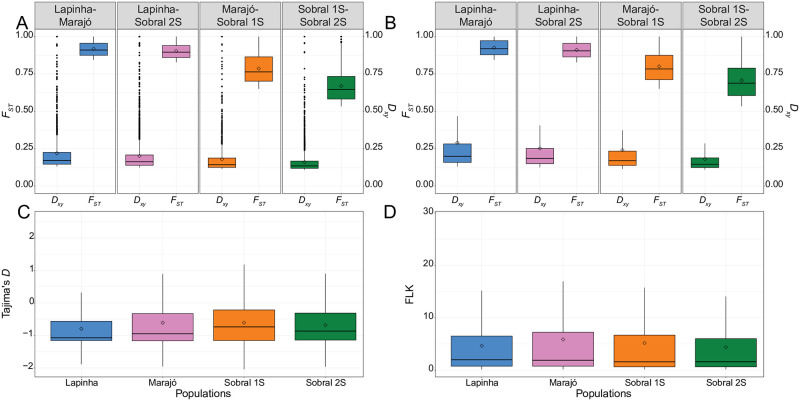
Fig 5. Measures of divergence in 1 kb non-overlapping genomic windows between the different populations of Lutzomyia longipalpis.
(A) Box plots of Dxy and FST values in the top 2.5% quantile (outlier) of each population comparison. (B) Box plots of Dxy and FST values for windows having both high Dxy and high FST (differentiation islands). (C) Box plots of Tajimas’ D values for the differentiation islands. (D) Box plots of FLK values for sites within differentiation islands. Box plots show the medians (lines) and interquartile ranges (boxes); the whiskers extend out from the box plots to 1.5 times the interquartile range, and values outside this limit are represented by dots. Mean values are represented by open diamonds.

