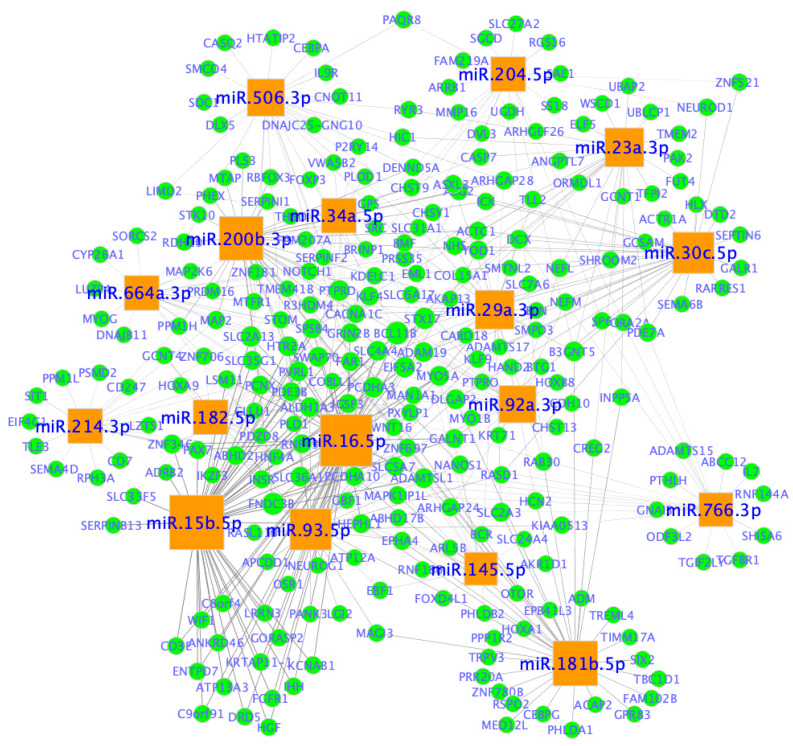
Figure 11.
miRNA-mRNA networks in ovarian cancer. Network nodes represent miRNAs and genes (mRNAs), whereas edges represent an association between a miRNA and a gene. miRNAs are represented by orange squares and genes are shown in blue circles. miRNA node size is proportional to the number of genes it is predicted to interact with. Network was created in Cytoscape (https://cytoscape.org/ (accessed on 20 January 2023)).

