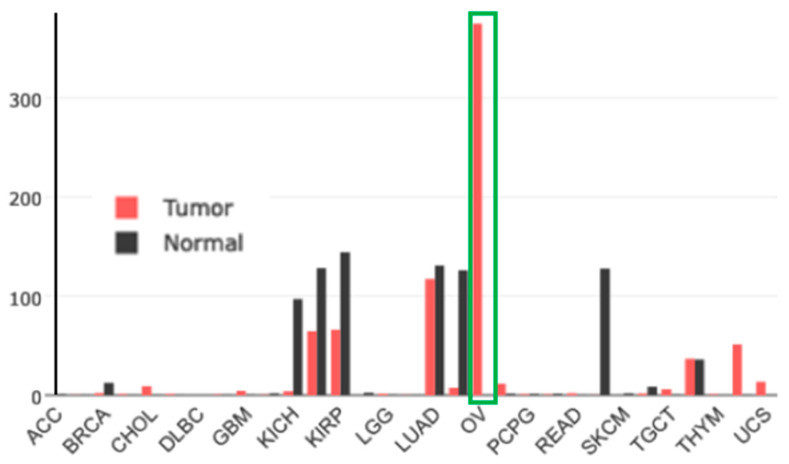
Figure 13.
Gene-expression profile of FOLR1 in human normal and tumor tissue samples using the gene-expression profiling interactive analysis tool (http://gepia.cancer-pku.cn/ (accessed on 17 February 2023)). The cancer and normal ovarian samples are shown in the green rectangle. The height of the bar represents the median expression of the certain tumor type or normal tissue.

