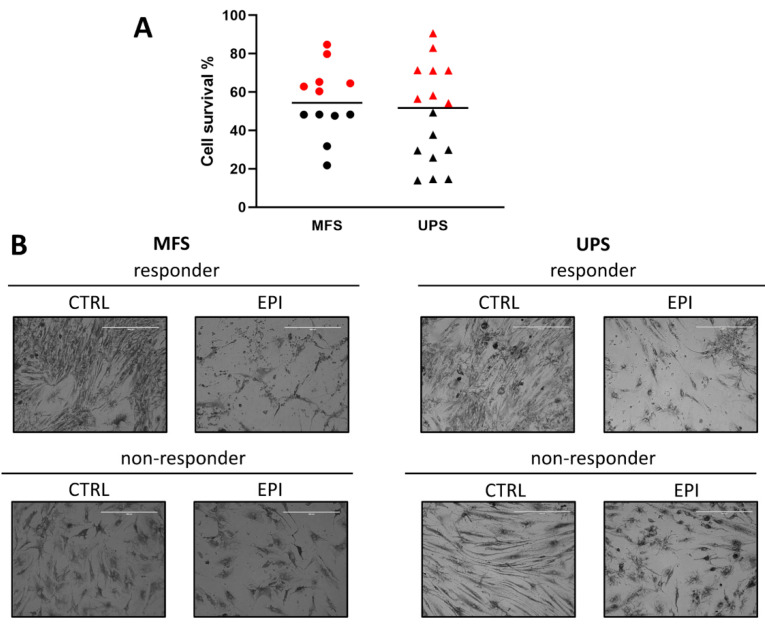
Figure 2.
Pharmacological analysis of MFS and UPS patient-derived primary cultures exposed to anthracycline. (A) Scatter plot showing cell survival of MFS and UPS patient-derived cell lines treated with epirubicin. Black horizontal lines represent median value. Red symbols represent non-responders samples (NR), black symbols represent responders samples (R) according to an arbitrary threshold of 50% cell survival. (B) Representative light microscope images of responder and non-responder MFS and UPS patient-derived cell lines, untreated (CTRL) or exposed to epirubicin (EPI), 10× magnification.

