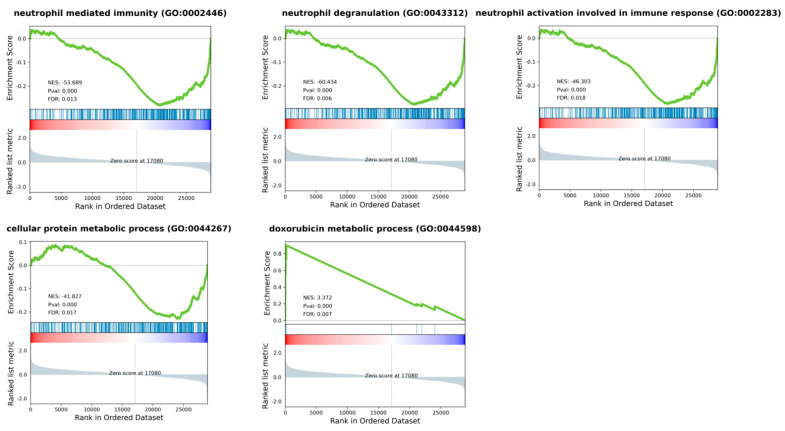
Figure 4.
Gene Set Enrichment Analysis (GSEA) plots for most representative enriched pathways of Gene Ontology Biological Process, when comparing MFS vs. UPS patients. Most dysregulated pathways were neutrophil activation, degranulation, and mediated immunity, as well as cellular protein and doxorubicin metabolic processes. Green line shows enrichment profile, red and blue bar represents the position of the gene set enrichment at the top (red) or bottom (blue) of the ranked list.

