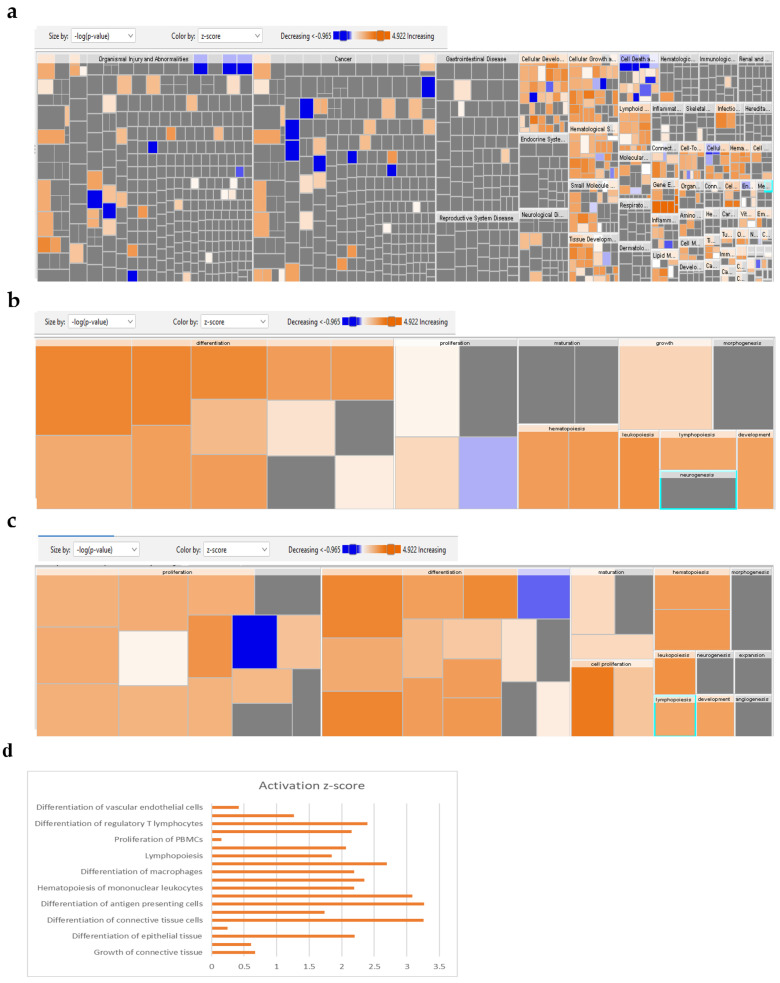
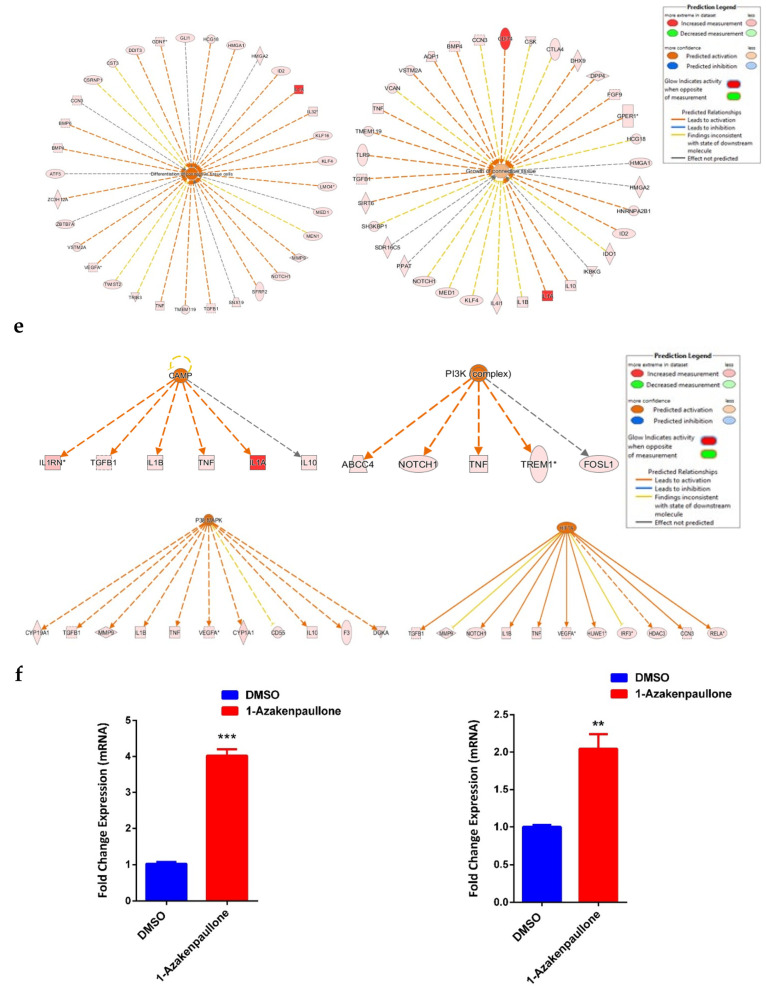
Figure 4.
Bioinformatic analysis of signaling networks regulated in 1-Azakenpaullon-treated human MSCs. (a) Disease and function heat map representing activation (red) or inhibition (blue) of the specified functional and disease categories identified in the upregulated transcripts in 1-Azakenpaullone-treated human MSCs. (b,c) Heat maps demonstrating affected tissue development and cellular development functional category, respectively. (d) Functional annotations associated with tissue development and the cellular development functional category, based on activation z-score, with a specific illustration of differentiation and growth of connective tissues. Figure legend illustrates the interaction between molecules within the network. (e) Illustration of CAMP, PI3K (Complex), P38 MAPK, and HIF1A genetic networks with predicted activated state based on transcriptome data with subsequent predicted effects on TNF and TGFB1 signaling. Figure legend illustrates the interaction between molecules within the network. (f) Validation of predicted activation effect on the downstream effector molecules TNF and TGFB1 in 1-Azakenpaullon-treated human MSCs versus DMSO-treated control using qRT-PCR on day 10 post osteoblast differentiation in the absence (blue) or presence (red) of 1-Azakenpaullon (3.0 µM). Gene expression was normalized to GAPDH. Data are presented as mean fold change ± SEM (n = 6) from two independent experiments; ** p < 0.005, *** p ≤ 0.0005. CAMP: cathelicidin antimicrobial peptide; PI3K (Complex): phosphatidylinositol 3-kinase complex; P38 MAPK: p38 mitogen-activated protein kinases; HIF1A: hypoxia-inducible factor-1 alpha; TNF: tumor necrosis factor; TGFB1: transforming growth factor-beta; DMSO: dimethyl sulfoxide.


