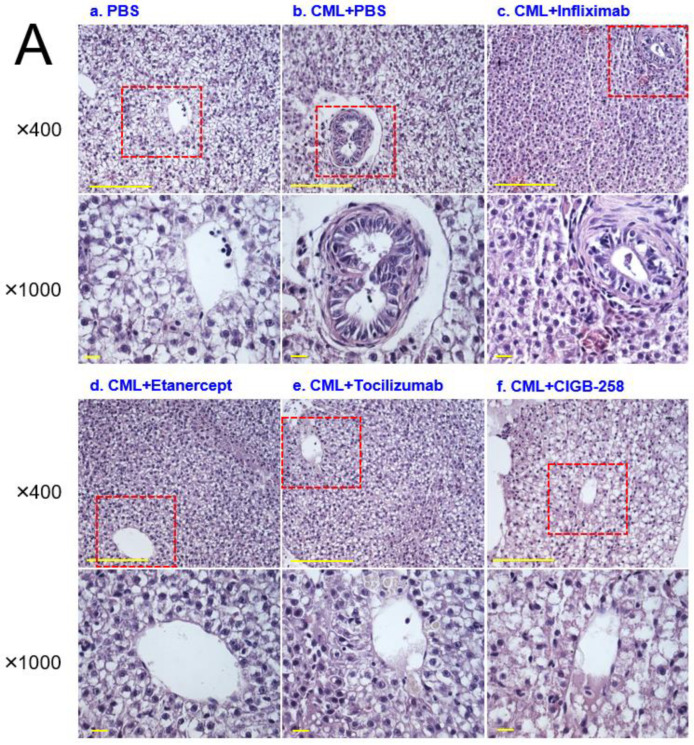
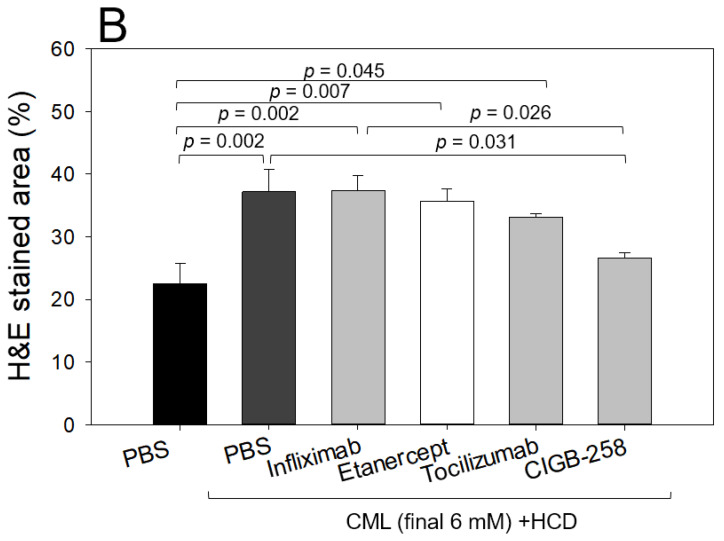
Figure 10.
Histologic analysis of the hepatic tissue from zebrafish injected with PBS alone (photograph a), CML+ PBS (photograph b), CML+ Infliximab (photograph c), CML + Etanercept (photograph d), CML + Tocilizumab (photograph e), and CML + CIGB-258 (photograph f) under the consumption of a high cholesterol diet (HCD). (A) Photographs show the infiltration of neutrophils by Hematoxylin & Eosin (H&E) staining after converting the Hematoxylin-stained area into a red intensity. The yellow scale bar indicates 100 μm. The red box area in image of 400× magnification was observed again at 1000× magnification (B) Quantification of the nucleus area from the H&E staining using Image J software version 1.53r (http://rsb.info.nih.gov/ij/ accessed on 15 September 2022). The statistical significance of the groups was indicated as p-values at the top of the graph.


