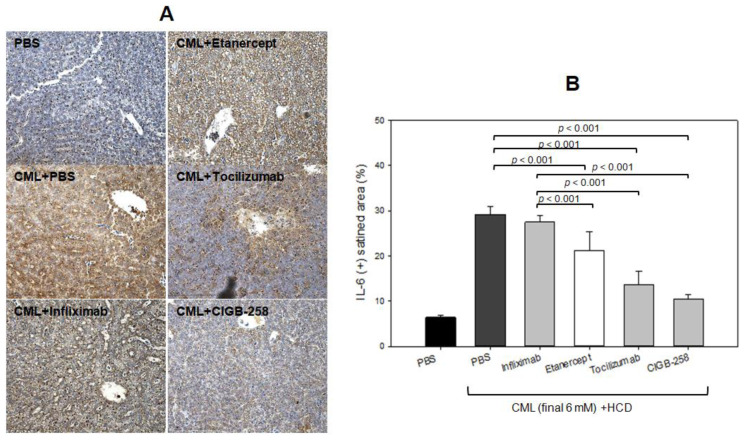
Figure 12.
Comparisons of the IL-6-stained area from immunohistochemistry (IHC) among each drug-injected zebrafish. (A) Representative image of IHC using IL-6 antibody-stained hepatic tissue. The scale bar indicates 100 μm. (B) Quantification of IL-6 antibody-stained area with brown intensity using Image J software version 1.53r (http://rsb.info.nih.gov/ij/ accessed on 14 October 2022).

