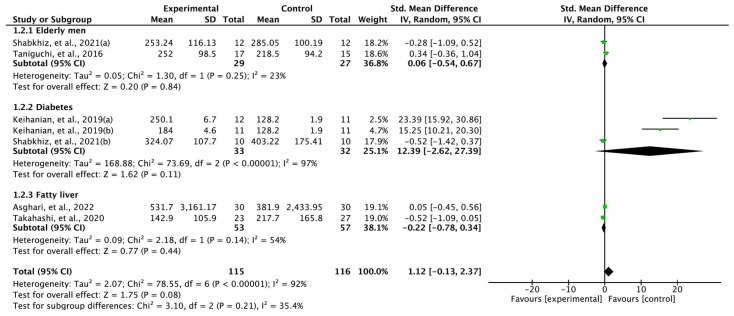
Figure 4.
Forest plot of between-group comparisons, i.e., intervention and control groups, of changes in exercise-induced fibroblast growth factor-21 levels [29,30,31,33,35]. Keihanian, et al., 2019(a) [29]—resistance exercise; Keihanian et al., 2019(b) [29]—aerobic exercise; Shabkhiz, et al., 2021(a) [30]—without type 2 diabetes; Shabkhiz et al., 2021(b) [30]—with type 2 diabetes.

