Figure 1.
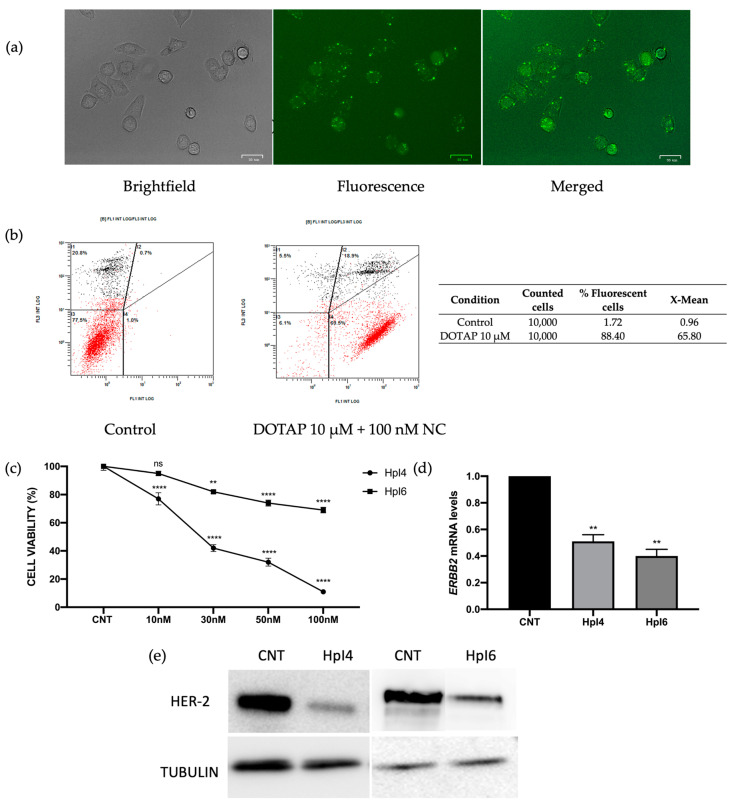
Uptake of the PPRHs in SKBR-3 cells was analyzed by fluorescent microscopy (a) and flow cytometry (b). 90,000 cells/well were plated and analyzed 24 h after transfection with a negative control of PPRH labeled with fluorescein (FAM). In (b), the intensity of green fluorescence (FL1) corresponding to transfected cells vs. the intensity of orange fluorescence corresponding to dead cells (FL3) is shown, and the results represent data from three independent determinations. (c) Dose-response to HpI4 and HpI6 in SKBR-3 cells (30,000 cells/well). The cell viability assay was performed 4 days after transfection. Results are expressed as a % of the control cells transfected with the negative control (NC). Results are expressed as a % of viability compared to cells transfected with DOTAP only, which corresponds to the control (CNT). (d) ERBB2 mRNA levels determined by RT-qPCR in SKBR-3 cells upon transfection of 100 nM of HpI4 or HpI6 for 24 h. In (c,d), results represent the mean +/− SEM from at least three experiments. Statistical significance was determined using a one-way ANOVA with Dunnett’s multiple comparison test (** p < 0.01, **** p < 0.0001, ns non-significant). (e) Representative image of HER-2 receptor protein levels analyzed by Western blot in SKBR-3 protein extracts from control cells or after 48 h of transfection with 100 nM of HpI4 or HpI6. The signal corresponding to tubulin was used to normalize the results. The determination was performed three times with consistent results.

