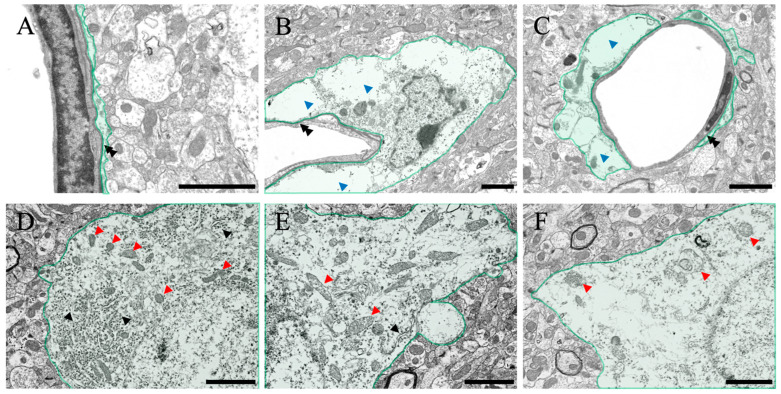
Figure 6.
Control (A,D), 3H (B,E), and 24H (C,F) representative electron microscopy images of the cerebral cortical tissues from the control animals and those from animals sacrificed 3 h and 24 h after ammonia treatment, respectively. (A–C) show the blood vessel and perivascular astrocytes in the cerebral cortex (green color). (D–F) show the neurons in the cerebral cortex (green color). Black double arrowheads show the basal membrane. Blue arrowheads indicate the perivascular edema of the cerebral cortex layer II/III. Black arrowheads indicate the rough endoplasmic reticulum. Red arrowheads indicate mitochondria. All scale bars = 2 μm.

