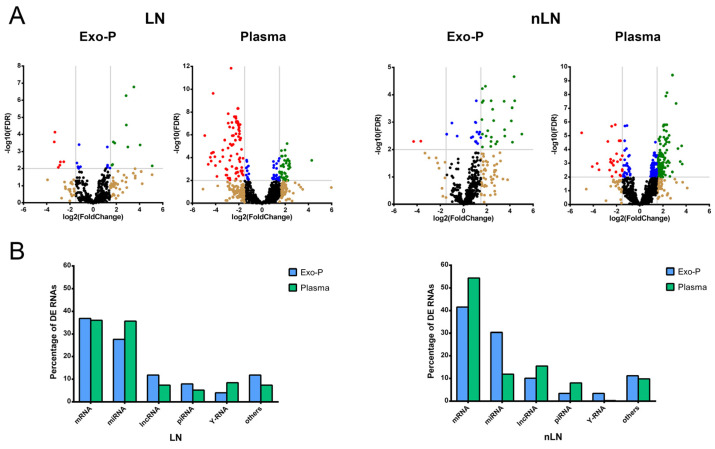
Figure 1.
Differentially expressed RNAs in SLE patients with or without renal damage in each biological fraction compared to control subjects. (A) Volcano plot depicts significantly altered RNAs found in LN or nLN. Each dot represents an RNA; non-significant false discovery rate (FDR > 0.05) and log2 fold-change ≥−1.5 or ≤1.5) in black, log2 fold-change ≤−1.5 or ≥1.5 in brown, significant FDR in blue and significant FDR and log2 fold-change ≥1.5, green (up-regulated) or ≤−1.5 in red (downregulated). The threshold dotted line for −log10(FDR) it was <0.05 and for log2 fold-change was ≤1.5 or ≥−1.5, and; (B) Bar graph of RNA subtype percentages according to the two biofluids in LN and nLN. DE: differentially expressed; Exo-P: plasma exosomes; LN: lupus nephritis; nLN: non lupus nephritis. lncRNA: long non-coding RNA; miRNA: microRNA; mRNA: messenger RNA; piRNA: PIWI-interacting RNA.

