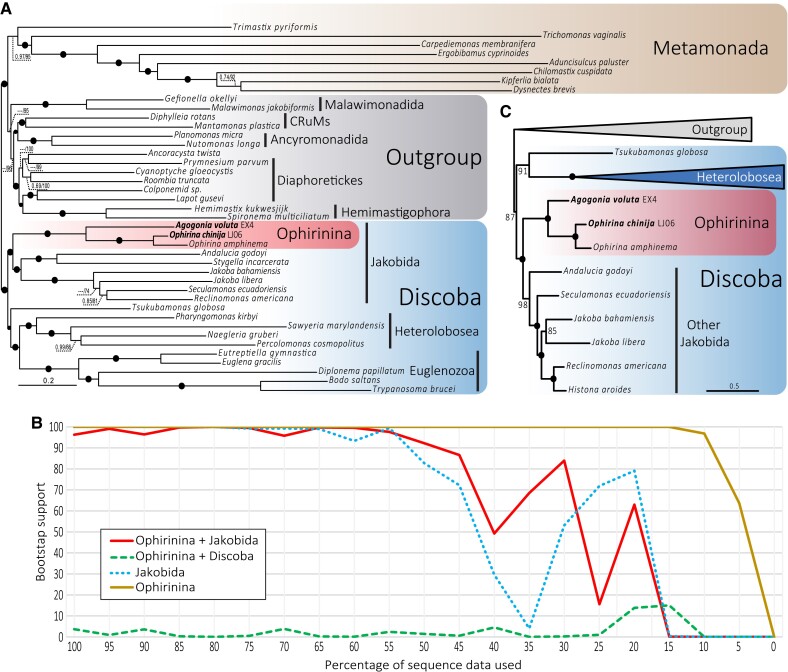
Fig. 4.
Phylogenomic analysis of Discoba. (A) ML phylogenomic tree based on 350 conserved proteins from Lax et al. (2018). The tree was reconstructed using 41 species and 112,726 amino acid positions with the LG + C60 + F + R7 model using the PMSF approximation for ML and the CAT-GTR model for Bayesian inference (BI). Numbers on branches indicate BI posterior probabilities and ML bootstrap values; bootstrap values <50% are indicated by ---. Branches with support values higher or equal to 0.99 BI posterior probability and 95% ML bootstrap are indicated by black dots. (B) ML bootstrap values for the monophyly of Jakobida (without Ophirinina), Ophirinina, Ophirinina + Jakobida, and the competing hypothesis of Ophirinina sister to all Discoba (Ophirinina + Discoba) as a function of the proportion of fast-evolving sites removed from the phylogenomic dataset. (C) ML phylogenomic tree based on 14 conserved mitochondrion-encoded proteins from Ettahi et al. (2021). The tree was reconstructed using 25 species and 4,683 amino acid positions with the LG + C60 + F + R7 model using the PMSF approximation. Numbers on branches indicate ML bootstrap values; branches with 100% support values are indicated by black dots. The complete tree is provided in supplementary figure S6, Supplementary Material online.

