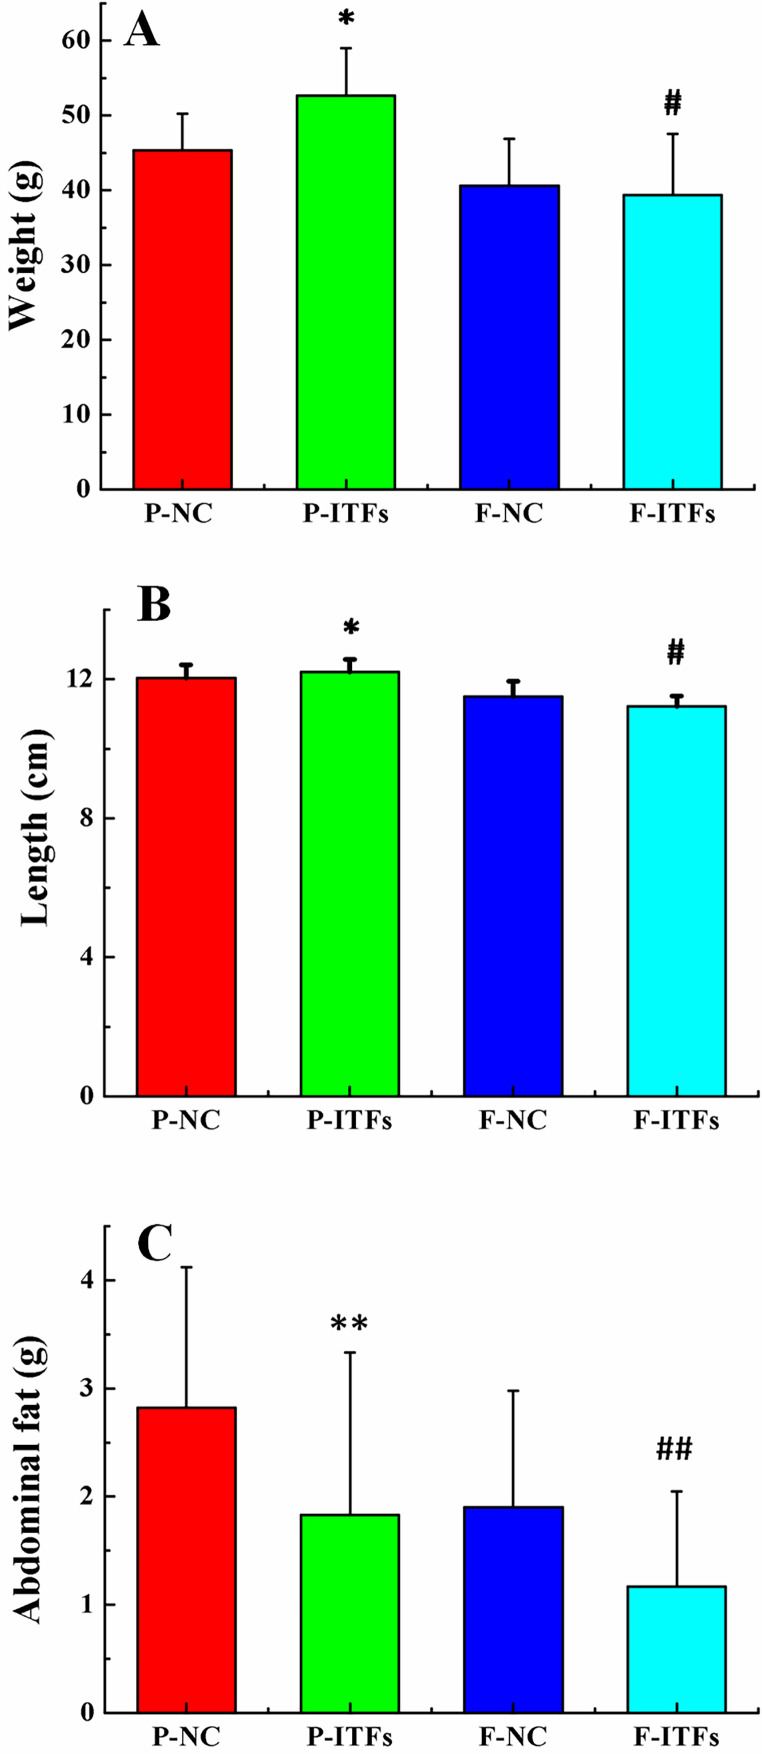
Fig. 3.
Terminal body weight (A), Length (B), and abdominal fat (C) of the normal control and experimental groups and their filial generations. *P<0.05, **P<0.01, compared to the P-NC group; #P<0.05, ##P<0.01, compared to the F-NC group. P-NC: parental normal control mice; P-ITFs: parental burdock inulin-type fructans supplemented mice; F-NC: filial normal control mice; F-ITFs: filial burdock inulin-type fructans supplemented mice.

