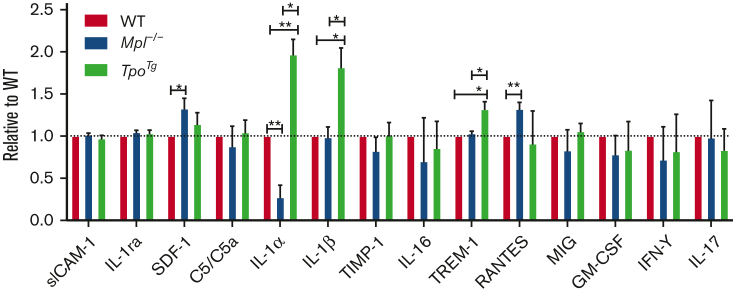
Figure 6.
Proinflammatory BM microenvironment in TpoTg mice. Cytokine and chemokine analysis of BM fluid from WT, Mpl−/−, and TpoTg mice with Proteome profiler array (mouse cytokine array panel A). The figure includes cytokine and chemokines that were detected in BM fluid and excludes proteins that were below detection level. n = 4 samples per genotype. Each sample was combined from 2 mice of the same genotype (a total of 8 mice were included per genotype). Data are presented as mean ± SEM. Only significantly different changes are indicated. 3 independent experiments. Student unpaired t test. ∗P < .05, ∗∗P < .005.

