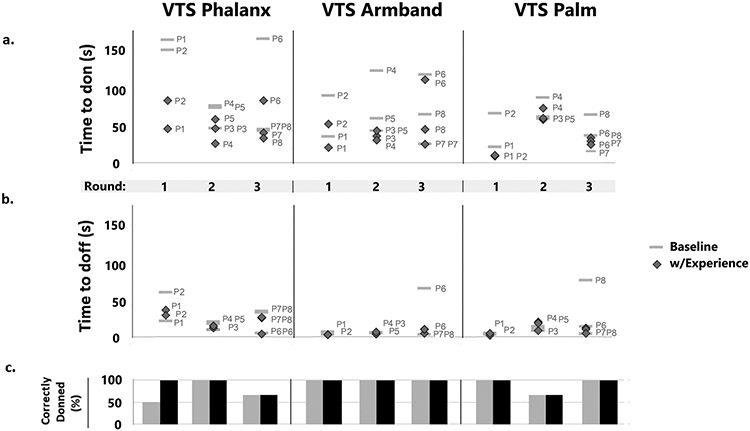
Fig. 5.
Quantitative data for each design and each round in the study. Participant numbers are listed by each data point. (a.) Time required to don the prototype for each participant. Each stack of markers represents one round in the study. (b.) Time to doff the prototype. (c.) Percent of participants who correctly donned the prototype for each round and each device.

