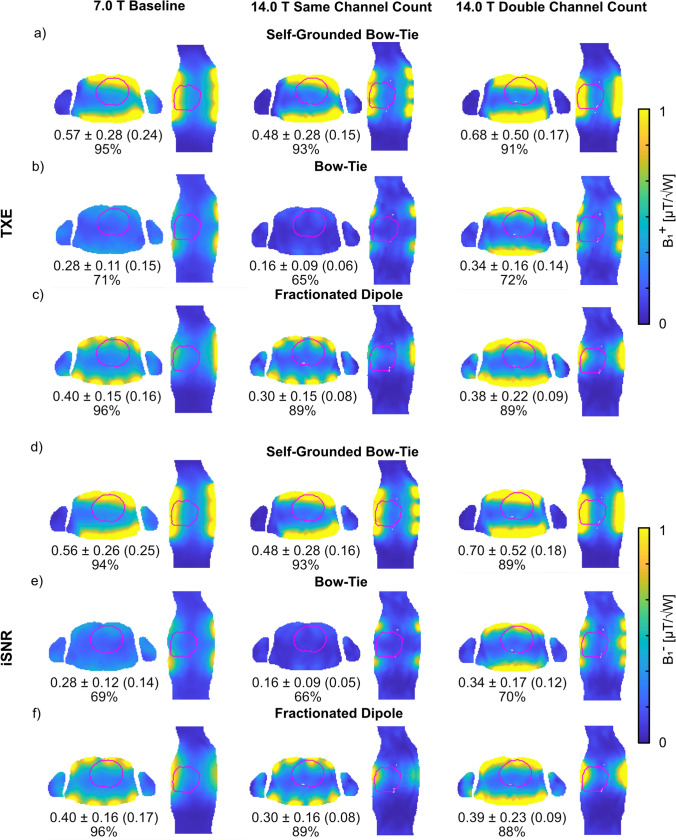
Fig. 2.
Axial and sagittal views through the center of the heart ROI showing realistic a–c B1+ (TXE) and d–f B1− (iSNR) superposition maps (accounting for sample, coil, and coupling losses). Annotations highlight the mean ± SD (minimum) TXE and iSNR values and the mean performance ratio in % over the whole 3D cardiac ROI using the a, d) self-grounded bow-tie antenna building block; b, e) bow-tie antenna building block; and c,f) the fractionated dipole antenna RF arrays at 7.0 T (baseline) and 14.0 T (same channel count and double channel count). The cardiac ROI is depicted in red

