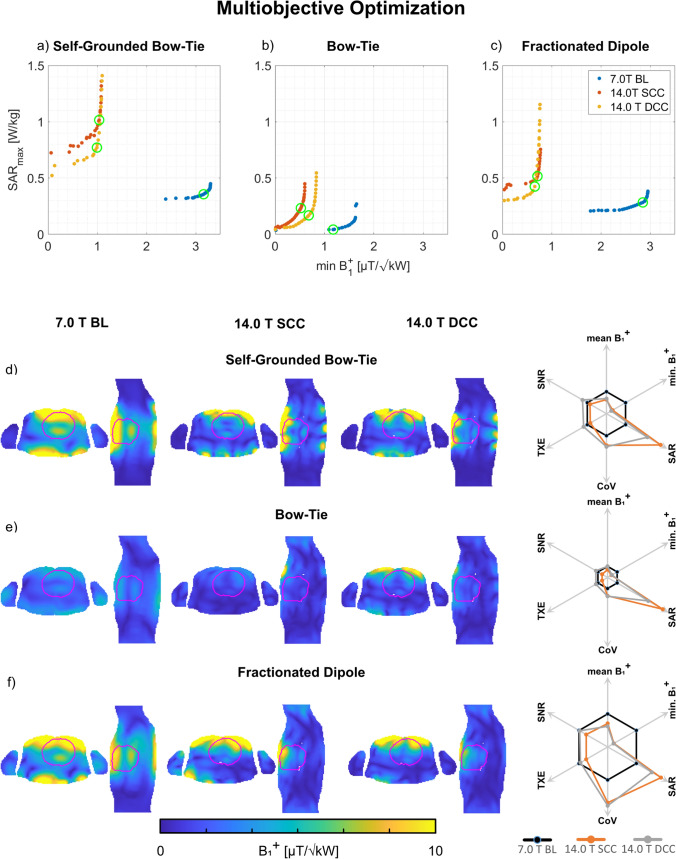
Fig. 5.
a–c Pareto front derived from the static phase and amplitude optimized pTx MOO approach using the a self-grounded bow-tie antenna building block; b bow-tie antenna building block; and c the fractionated dipole antenna RF array configurations at 7.0 T (baseline, BL) and 14.0 T (same channel count, SCC, double channel count, DCC). Each point of the solution represents one optimized excitation vector where a trade-off between the minimum B1+ROI and the maximum SAR10g was found. The green circles indicate the highest minimum B1+ROI/√SAR10g ratio. d–f Axial and sagittal views through the center of the heart (depicted in red) illustrating B1+ efficiency maps (B1+/√1 kW) obtained for the excitation vectors with the highest minimum B1+ROI/√SAR10g ratio (indicated by the green circles in a-c). The spider diagrams illustrate the relative changes of the mean B1+ROI, minimum B1+ROI, maximum SAR10g, CoV(B1+ROI), TXE, and intrinsic SNR values for the 14.0 T SCC (orange) and DCC (grey) with respect to the 7.0 T baseline (black)

