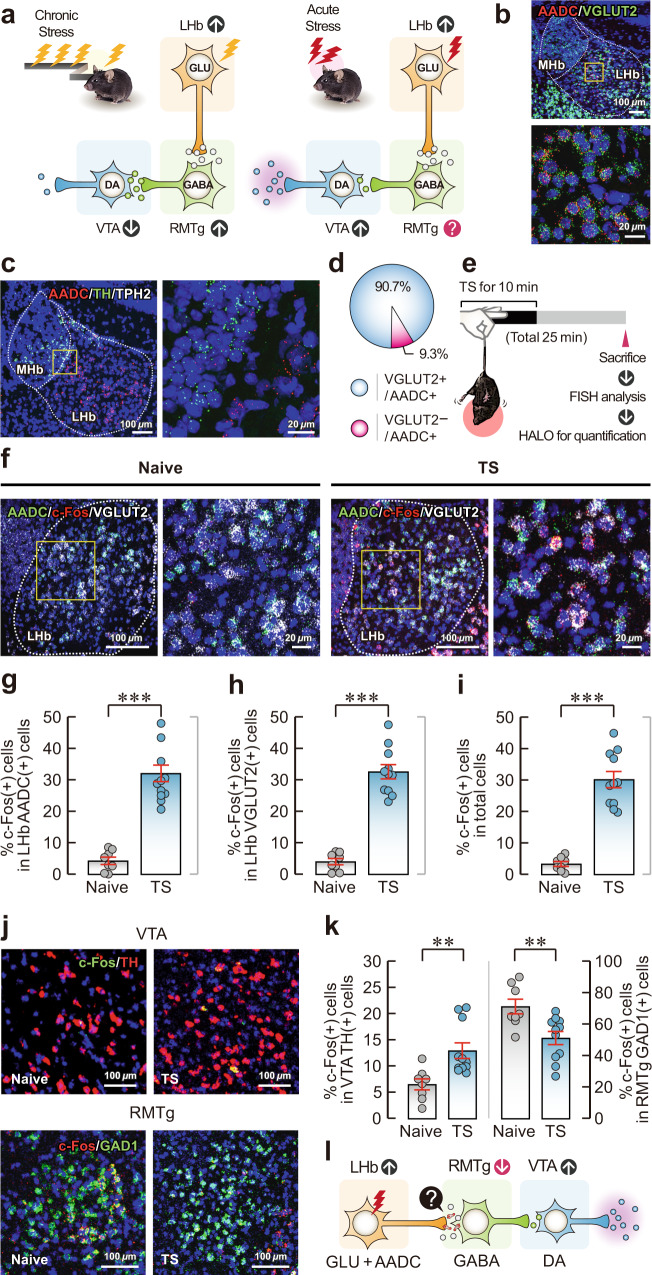
Fig. 1. Acute stress alters the neuronal activity of the LHb-RMTg-VTA pathway.
a Schematic of changes in neuronal activity of the LHb-RMTg-VTA pathway in chronic and acute stress responses. DA, dopamine; GABA, gamma-aminobutyric acid; GLU, glutamate. b, c Expression of AADC/VGLUT2 (b) and AADC/TH/TPH2 (c) in the LHb by FISH. d Pie chart of the percentage of VGLUT2-expressing AADC-positive cells in the LHb by FISH (n = 3 independent mice). e, Experimental schematic of acute tail suspension (TS)-induced stress, followed by FISH analysis. f Expression of AADC/c-Fos/VGLUT2 in the LHb of naïve and TS model mice by FISH. g–i Percentages of c-Fos-expressing AADC-positive cells (n = 8 independent Naïve mice and n = 11 independent TS mice) (g), c-Fos-expressing VGLUT2-positive cells (n = 8 independent Naïve mice and n = 11 independent TS mice) (h) and c-Fos-expressing cells in total cells in the LHb by FISH (n = 8 independent Naïve mice and n = 11 independent TS mice) (i). j Expression of c-Fos/TH in the VTA (top) and c-Fos/GAD1 in the RMTg (bottom) in naïve and TS model mice by FISH. k Percentages of c-Fos-expressing TH-positive cells in the VTA (left; n = 8 independent Naïve mice and n = 11 independent TS mice) and c-Fos-expressing GAD1-positive cells in the RMTg (right; n = 8 independent Naïve mice and n = 11 independent TS mice) of naïve and TS model mice. l Schematic of acute stress-mediated alterations in neuronal activity in the LHb-RMTg-VTA pathway. Magnified images of the regions of interest (yellow squares) are shown next to the main images in (b), (c) and (f). Unless otherwise stated, statistical comparisons were performed using a two-tailed unpaired t test. **p < 0.01 and ***p < 0.001. Data are presented as the mean values ± s.e.m. Source data are provided as a Source Data file.

