Fig. 7.
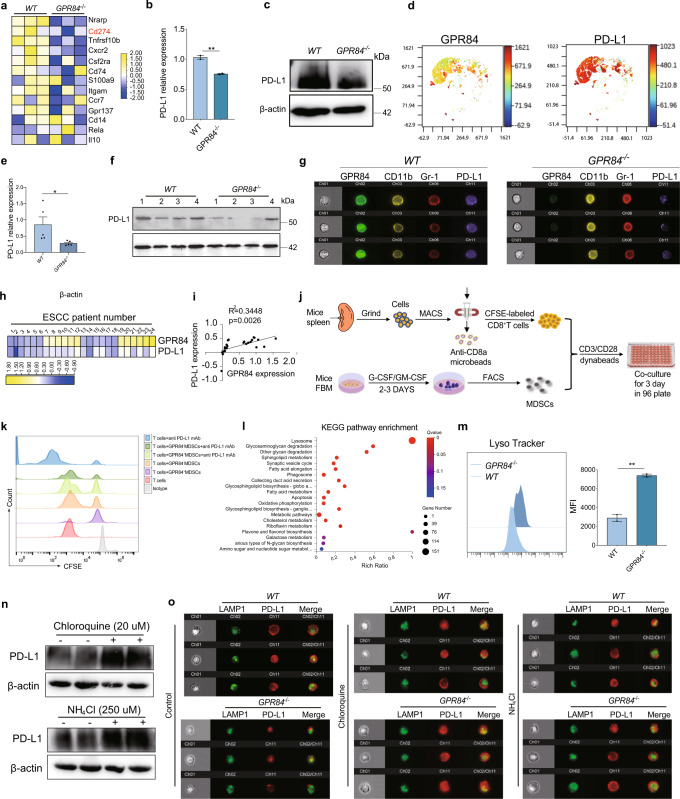
PD-L1 degradation increases in GPR84−/− MDSCs. a Heat maps of RNA-seq data from tumor tissues were performed. Representative genes associated with MDSCs from each category are shown. b, c PD-L1 mRNA and protein expression in MDSCs induced by bone marrow cells isolated from GPR84−/− and WT normal mice were measured by qPCR and western blot. d The Dimension reduction analysis of PD-L1in GPR84+ MDSCs induced by GM-CSF and G-CSF. e, f The mRNA and protein levels of PD-L1 expression in spleen MDSCs isolated from GPR84−/− and WT tumor-bearing mice were measured by qPCR and western blot. g Imaging flow cytometry was used to examine PD-L1 expression in MDSCs. h, i Heatmap showing expression of CD33, PD-L1, and GPR84 in PBMCs derived from esophageal cancer patients. j The schematic diagram shows the co-incubation process of in vitro induced MDSCs and CD8+ T cells. k The proliferation of CD8+ T cells in different MDSCs coculture group and anti-PD-L1mAb treated group. l KEGG analysis of the RNA-seq data from WT and GPR84−/− MDSCs derived from B16 tumor-bearing mice. m Fluorescence intensities of Lysotracker were measured in GPR84−/− MDSCs induced by GM-CSF and G-CSF by flow cytometry. n, o Western blot and imaging flow cytometry were performed to investigate the effect of GPR84 on PD-L1 expression in the absence and presence of lysosomal inhibitors NH4Cl and chloroquine. Data are represented as mean ± SEM. *p < 0.05, **p < 0.01

