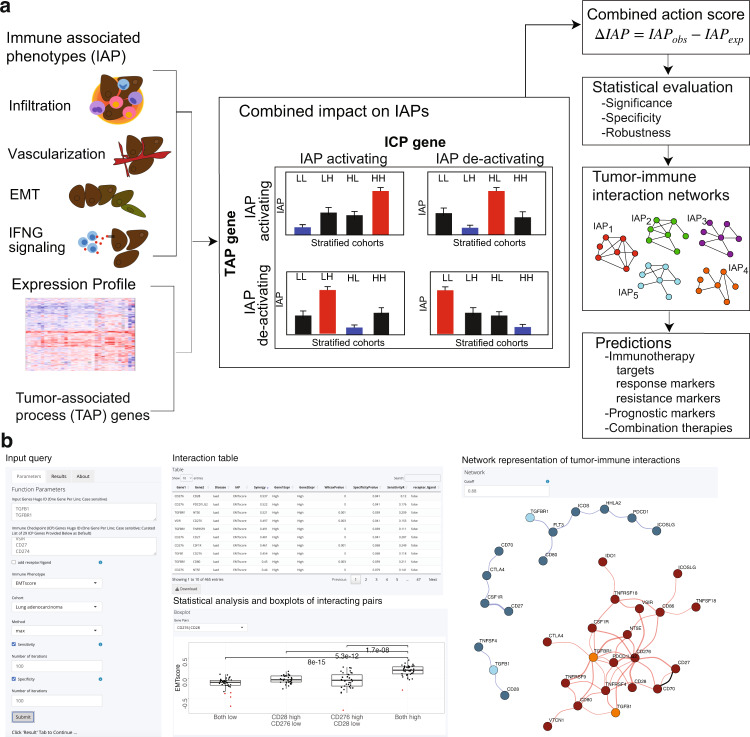
Fig. 1. Overview of Imogimap.
a Immune-associated phenotype (IAP) levels and mRNA expression values are the inputs to ImogiMap. Based on the variation in IAP levels across patients, the algorithm calculates combined action scores between tumor-associated processes (TAP) that may constitute a functional gene signature and therapeutically actionable immune checkpoint (ICP) genes. For each TAP-ICP gene pair, the patient cohort is stratified into four sub-cohorts (LL, LH, HL, HH), and IAP levels are measured within each sub-cohort. A baseline sub-cohort (marked blue) and a target group (marked red) are determined based on four null assumptions on the relationship of the two genes with the IAP (both activating, both deactivating, and one activating while the other deactivating) (see “Methods”). A combined action score under each assumption is calculated and their maximum is reported as the combinatorial association of the TAP-ICP pair with the IAP. For each IAP, a network of gene interactions from specific, robust, and significant interactions is constructed to reflect combinatorial relations between TAPs and ICPs in the context of an IAP. b ImogiMap web interface enables queries for oncogenes, immune checkpoints, and immune phenotypes for each 33 cancer types. The outputs are an immune-tumor interactions table with statistical validations (significance, specificity, robustness), network models of tumor-immune checkpoint interactions, and statistical significance analysis across patient cohorts for each interacting pair.

