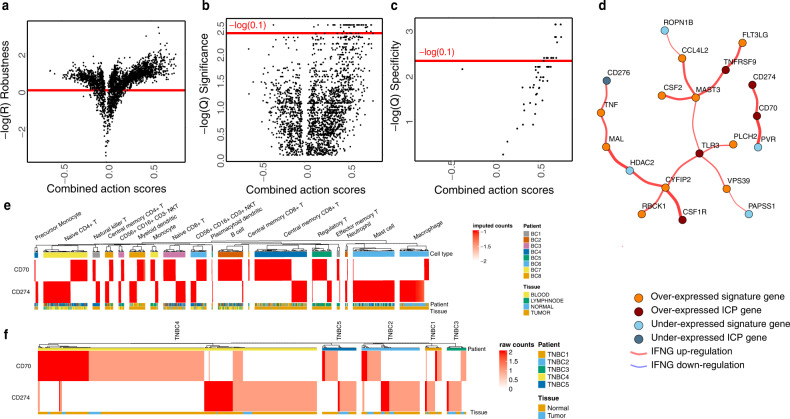
Fig. 3. Interactions of T-cell dysfunction signature genes with immune checkpoints in breast cancer.
ImogiMap-based assessment of combinatorial interactions for T-cell dysfunction signature genes in basal-like breast cancer (based on RNA expression data from tumors of 172 patients), and therapeutically actionable ICPs, based on their associations with the IFNG expression. a Combined action score robustness metric. A normalized root mean square deviation (RMSD) is calculated for each combined action score through random sampling (1000x) of sub-cohorts with 70% coverage of the complete cohort. Scores with high robustness, (red horizontal line) are selected for further analysis (see “Methods”). b The significance metric for the combined action score. An FDR (Benjamini-Hochberg (BH) method) corrected -value based on the Wilcoxon signed-rank test is calculated for robust scores. Scores with are selected for further analysis. c A BH-corrected Q-value for specificity is calculated for each robust and significant interaction. Scores with are selected for further analysis. d The graphical network representing robust, significant, and specific combinatorial associations with IFNγ levels. Red (blue) edges represent upregulation (downregulation) of IFNG gene expression level. Dark red (dark blue) vertices identify overexpression (low-expression) of ICP genes and orange (blue) vertices identify overexpression (low-expression) of T-cell dysfunction signature genes. The single cell mRNA expression patterns of CD70 and CD274 in (e) breast cancer-associated immune cells11 and (f) tumors from five patients with triple-negative breast cancer patients34.

