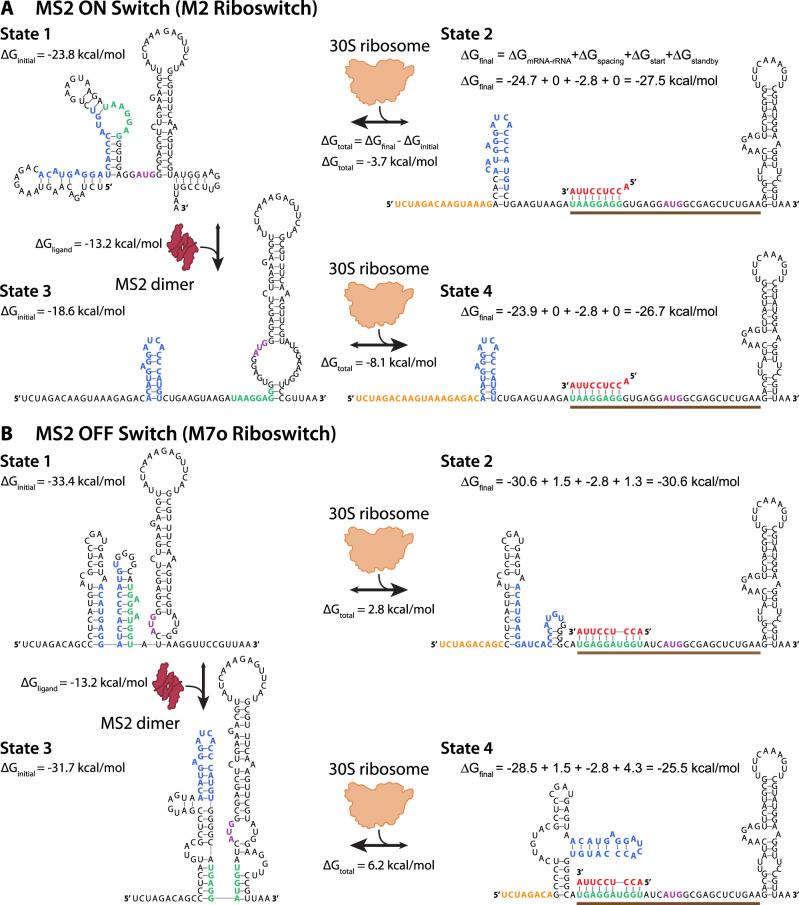
Fig. 3. Sequence, structure, and interactions controlling riboswitch function.
The model-predicted mRNA structures and ribosome-mRNA binding free energies for the A MS2 ON switch (M2 riboswitch) and the B MS2 OFF switch (M7o riboswitch) across its four most relevant states. State 1 shows the initial mRNA structure and its Gibbs free energy of folding (ΔGinitial) when the MS2 coat protein is not bound. State 2 shows the change in mRNA structure and the final Gibbs free energy (ΔGfinal) when the ribosome binds to the mRNA in State 1. The free energy model for calculating ΔGfinal includes hybridization between the mRNA and ribosomal RNA (ΔGmRNA-rRNA), base pairing between the tRNA and start codon (ΔGstart), and energetic penalties for non-optimal spacing (ΔGspacing) and an inaccessible standby site (ΔGstandby). State 3 shows how the mRNA structure changes when the MS2 coat protein binds to its cognate RNA aptamer with binding free energy ΔGligand, which results in a change in mRNA folding free energy (ΔGinitial). State 4 shows the change in mRNA structure and final Gibbs free energy (ΔGfinal) when the ribosome binds to the mRNA in State 3. The translation initiation rates are predicted based on the difference in initial and final Gibbs free energies (ΔGtotal) according to Boltzmann’s relationship. Nucleotides are colored according to their interactions, including (blue) the RNA aptamer domain, (red) the last 9 nucleotides of the 16S ribosomal RNA, (green) the Shine–Dalgarno sequence, (purple) the start codon, and (orange) the standby site. The brown bar is the ribosomal footprint for initiation.

